QUESTION IMAGE
Question
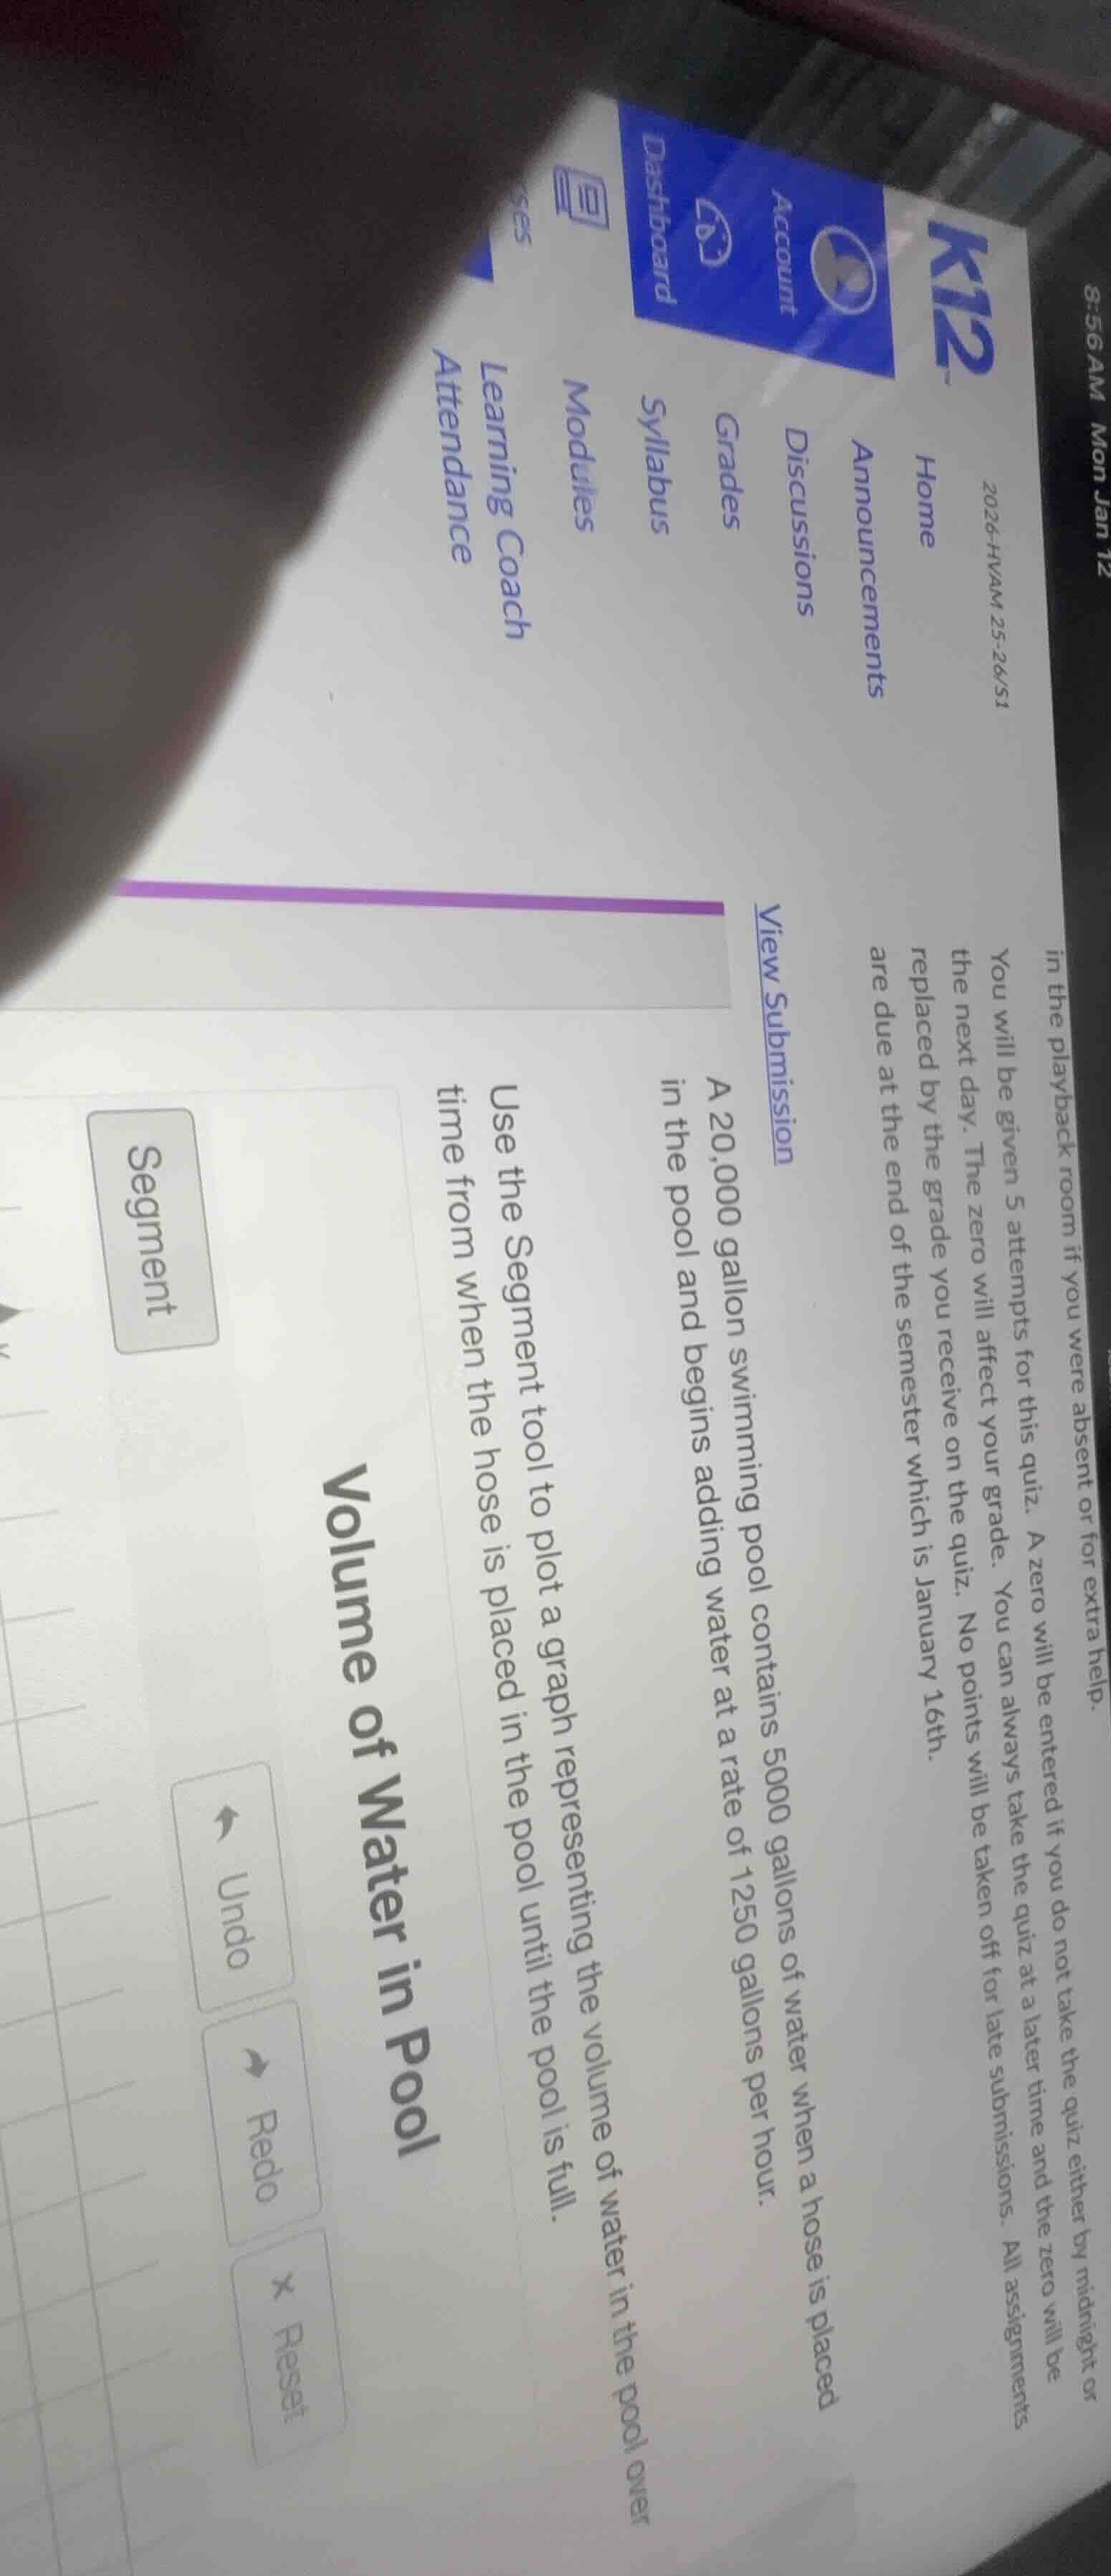
volume of water in pool a 20,000 gallon swimming pool contains 5000 gallons of water when a hose is placed in the pool and begins adding water at a rate of 1250 gallons per hour. use the segment tool to plot a graph representing the volume of water in the pool over time from when the hose is placed in the pool until the pool is full.
Step1: Define variables and starting volume
Let $t$ = time in hours since hose is placed, $V(t)$ = volume in gallons at time $t$. Initial volume: $V(0) = 5000$ gallons.
Step2: Set up volume function
Volume increases at 1250 gal/hour, so:
$V(t) = 5000 + 1250t$
Step3: Find time to fill the pool
Full volume = 20,000 gallons. Solve for $t$:
$20000 = 5000 + 1250t$
$1250t = 20000 - 5000$
$1250t = 15000$
$t = \frac{15000}{1250} = 12$ hours
Step4: Identify key points for graph
- Starting point: $(0, 5000)$
- Ending point: $(12, 20000)$

Snap & solve any problem in the app
Get step-by-step solutions on Sovi AI
Photo-based solutions with guided steps
Explore more problems and detailed explanations
The graph is a straight line connecting the points $(0, 5000)$ (time=0 hours, volume=5000 gallons) and $(12, 20000)$ (time=12 hours, volume=20000 gallons), with the volume function $V(t) = 5000 + 1250t$ for $0 \leq t \leq 12$.