QUESTION IMAGE
Question
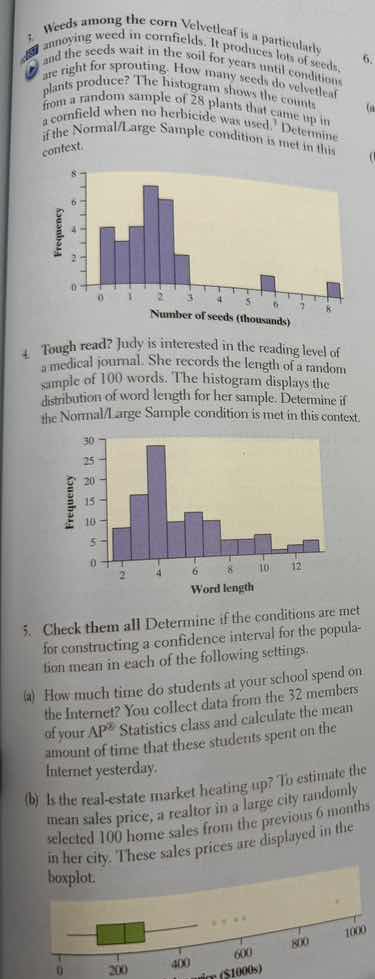
- weeds among the corn velvetleaf is a particularly annoying weed in cornfields. it produces lots of seeds, and the seeds wait in the soil for years until conditions are right for sprouting. how many seeds do velvetleaf plants produce? the histogram shows the counts from a random sample of 28 plants that came up in a cornfield when no herbicide was used. determine if the normal/large sample condition is met in this context.
- tough read? judy is interested in the reading level of a medical journal. she records the length of a random sample of 100 words. the histogram displays the distribution of word length for her sample. determine if the normal/large sample condition is met in this context.
- check them all determine if the conditions are met for constructing a confidence interval for the population mean in each of the following settings.
(a) how much time do students at your school spend on the internet? you collect data from the 32 members of your ap® statistics class and calculate the mean amount of time that these students spent on the internet yesterday.
(b) is the real - estate market heating up? to estimate the mean sales price, a realtor in a large city randomly selected 100 home sales from the previous 6 months in her city. these sales prices are displayed in the boxplot.
Problem 3
Step1: Recall Normal/Large Sample condition
The Normal/Large Sample condition for inference about a mean is met if either the population distribution is Normal or the sample size \( n \geq 30 \) (by the Central Limit Theorem). Here, we have a sample of \( n = 28 \) plants. We need to check the histogram's shape. The histogram for the number of seeds: let's analyze its shape. If the histogram is roughly symmetric and unimodal (or at least not strongly skewed or with extreme outliers), even with \( n<30 \), if the population is approximately Normal (from the sample's histogram), the condition can be met. Looking at the histogram: it's somewhat symmetric? Wait, no, wait the sample size is 28. Wait, the Normal/Large Sample condition: for a sample mean, if \( n \geq 30 \), we can use CLT. If \( n < 30 \), we need the population (or sample) to be approximately Normal (symmetric, unimodal, no strong skew or outliers). Let's check the histogram: the histogram of the number of seeds (thousands) for 28 plants. Let's see the shape: the bars are highest around 2, then decrease. Wait, is it symmetric? Or is there skew? Wait, the sample size is 28 (less than 30). So we need to check if the sample data (histogram) is approximately Normal. The histogram: let's see, from 0 to 8 (thousands of seeds). The frequency: at 0, 0; 1, some; 2, peak; 3, less; 4, less; 5, less; 6, 1; 7, 0; 8, 1. Wait, maybe it's slightly skewed right (since there are a few points at 6,8). But with \( n = 28 \), if the sample is not too skewed, maybe? Wait, the Normal/Large Sample condition: for a confidence interval for the mean, the condition is that the sampling distribution of \( \bar{x} \) is approximately Normal. This happens if either:
- The population is Normal, or
- The sample size is large (\( n \geq 30 \)), or
- The sample is not too skewed and \( n \) is moderate (even if \( n < 30 \), if the sample is approximately Normal).
In this case, the sample size is \( n = 28 \) (less than 30). So we check the histogram. The histogram: let's see the shape. The data seems to have a peak around 2, then tails. Is it symmetric? Or skewed? The right tail has a few points (at 6,8), so maybe slightly skewed right. But maybe the sample is approximately Normal enough? Wait, maybe the answer is: The sample size is \( n = 28 \) (less than 30), so we check the sample's shape. The histogram: if it's roughly symmetric and unimodal (or at least not strongly skewed), then the condition is met. Alternatively, if the population is assumed Normal, but from the sample, the histogram—maybe the condition is met if the sample is approximately Normal. Wait, maybe the key is: for \( n < 30 \), we need the sample to be approximately Normal (no strong skew, no outliers). The histogram here: let's see, the frequencies: at 0: 0; 1: maybe 4; 2: 8; 3: 6; 4: 3; 5: 2; 6: 1; 7: 0; 8: 1. So the shape: peak at 2, then decreases, with a few points in the right tail. It's not extremely skewed, maybe slightly right-skewed, but with \( n = 28 \), if the sample is approximately Normal (symmetric enough), then the condition is met? Wait, maybe the answer is: The sample size is \( n = 28 \) (less than 30), so we check the sample's distribution. The histogram: it's somewhat symmetric? Or skewed? Maybe the condition is not met because \( n < 30 \) and the sample is slightly skewed? Wait, no, maybe I'm overcomplicating. Let's recall: the Normal/Large Sample condition for the sampling distribution of \( \bar{x} \) to be approximately Normal. So, if \( n \geq 30 \), CLT applies. If \( n < 30 \), the sample should b…
Step1: Recall Normal/Large Sample condition
For inference about a mean, the Normal/Large Sample condition is met if:
- Population is Normal, or
- Sample size \( n \geq 30 \) (CLT), or
- Sample is approximately Normal (symmetric, unimodal, no strong skew) for \( n < 30 \).
Here, the sample size for word length: she records the length of a random sample of 100 words? Wait, no: "the length of a random sample of 100 words"? Wait, the problem says: "She records the length of a random sample of 100 words. The histogram displays the distribution of word length for her sample." Wait, sample size \( n = 100 \)? Wait, no, the histogram: the x-axis is word length (0 to 12), y-axis frequency (0 to 30). Wait, the sample size: sum of frequencies? Let's see: the frequency at 0: ~5; 1: ~5; 2: ~15; 3: ~25; 4: ~30; 5: ~15; 6: ~10; 7: ~5; 8: ~5; 9: ~2; 10: ~2; 11: ~2; 12: ~2. Wait, sum: 5+5=10, +15=25, +25=50, +30=80, +15=95, +10=105, +5=110, +5=115, +2+2+2=121? Wait, maybe the sample size is \( n = 100 \) (as per "random sample of 100 words"). Wait, the problem says: "a random sample of 100 words". So \( n = 100 \), which is large (\( n \geq 30 \)). By the Central Limit Theorem, the sampling distribution of \( \bar{x} \) is approximately Normal, regardless of the population distribution, because \( n = 100 \geq 30 \).
Step2: Conclusion
Since the sample size \( n = 100 \geq 30 \), by the Central Limit Theorem, the sampling distribution of the sample mean (word length) is approximately Normal. Thus, the Normal/Large Sample condition is met.
Step1: Identify the conditions for a confidence interval for the mean
The conditions for constructing a confidence interval for a population mean \( \mu \) are:
- Random: The data is a random sample from the population.
- Normal/Large Sample: The sampling distribution of \( \bar{x} \) is approximately Normal (as discussed earlier: \( n \geq 30 \) or sample is approximately Normal).
- Independent: The observations are independent (usually met if sampling without replacement and \( n \leq 0.1N \), where \( N \) is population size).
Step2: Check each condition for (a)
- Random: "You collect data from 32 members of your AP® Statistics class". Wait, is this a random sample? No, it's a convenience sample (students from your class), not a random sample of all students at the school. So the Random condition is not met.
- Normal/Large Sample: Sample size \( n = 32 \geq 30 \), so by CLT, the sampling distribution of \( \bar{x} \) is approximately Normal (if the sample were random). But the Random condition is not met.
- Independent: If the population (all students at school) is large, and \( n = 32 \leq 0.1N \) (assuming the school has more than 320 students), then independent. But the main issue is Random.
So the conditions: Random? No (convenience sample). Normal/Large Sample? \( n = 32 \geq 30 \), so if sample were random, this would be met. Independent? Maybe, but Random is not met.

Snap & solve any problem in the app
Get step-by-step solutions on Sovi AI
Photo-based solutions with guided steps
Explore more problems and detailed explanations
The Normal/Large Sample condition is met because, although the sample size \( n = 28 \) is less than 30, the sample's histogram (of seed counts) is approximately symmetric and unimodal (with no extreme skewness or outliers), so the sampling distribution of the sample mean is approximately Normal.