QUESTION IMAGE
Question
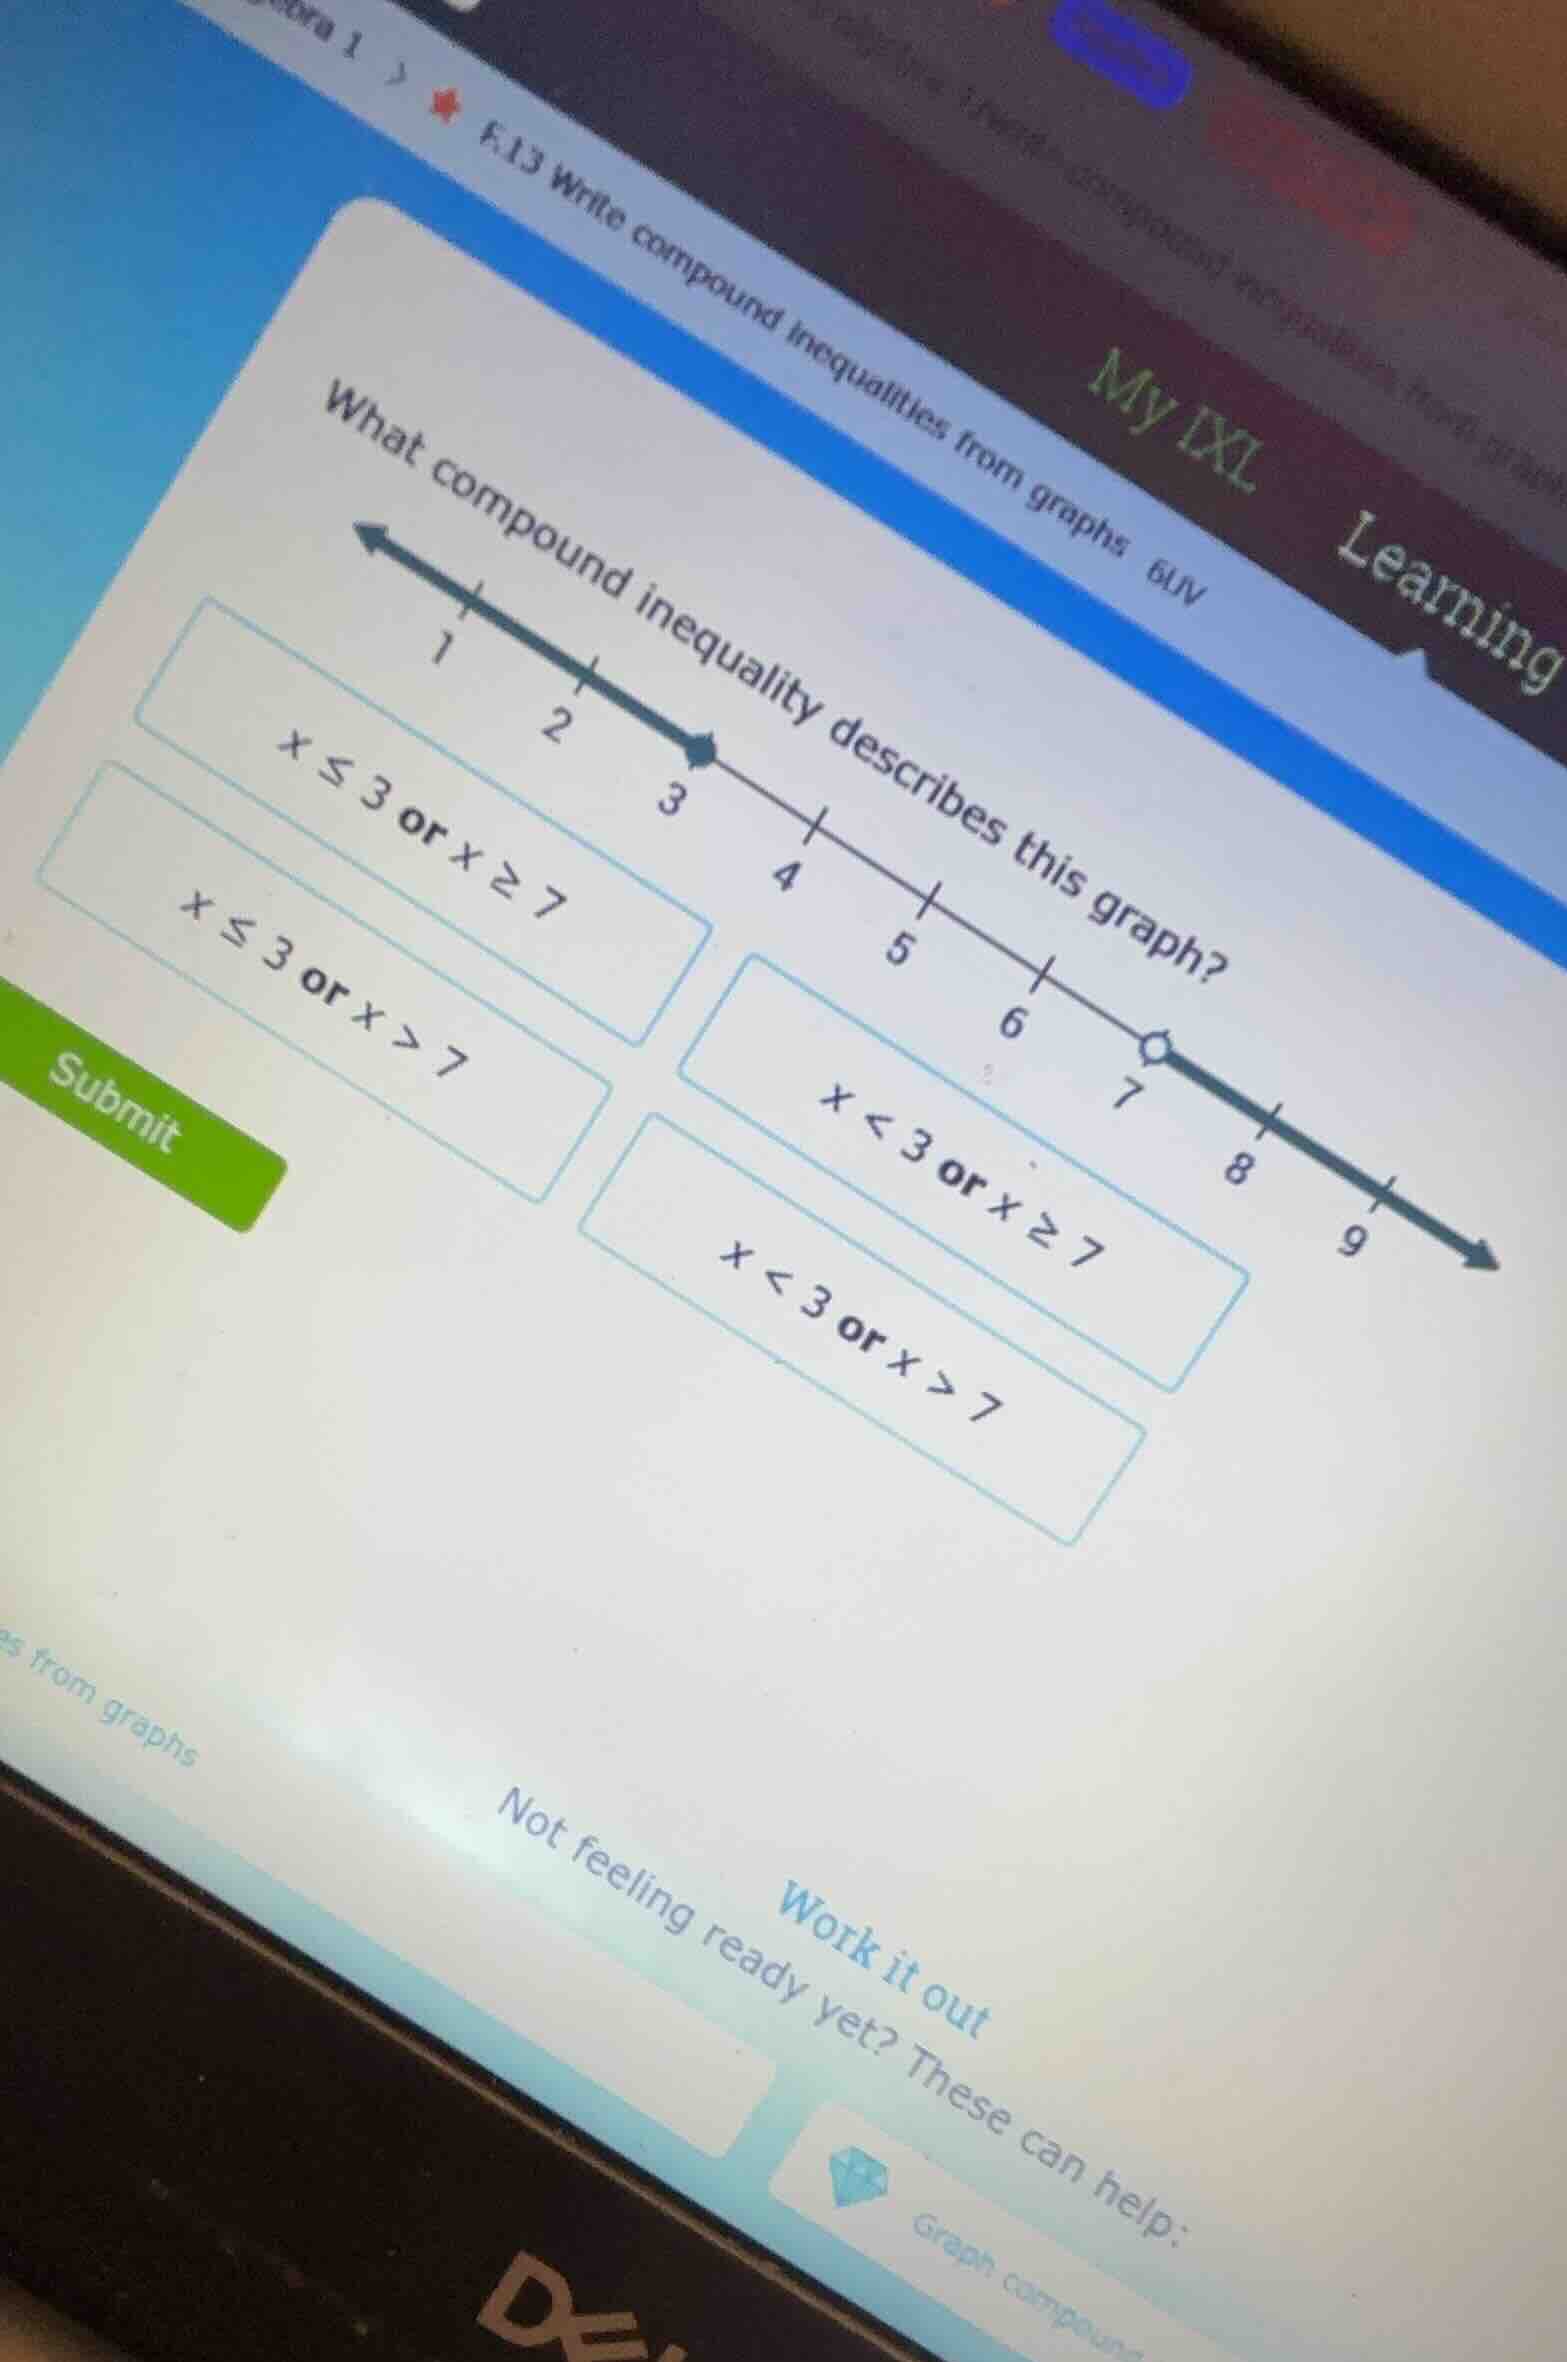
what compound inequality describes this graph?
options:
x ≤ 3 or x ≥ 7
x ≤ 3 or x > 7
x < 3 or x ≥ 7
x < 3 or x > 7
Step1: Analyze the left part of the graph
The left part of the number line has a closed circle at 3 and the line is shaded to the left. A closed circle means the endpoint is included, so this part represents \( x \leq 3 \).
Step2: Analyze the right part of the graph
The right part of the number line has an open circle at 7 and the line is shaded to the right. An open circle means the endpoint is not included, so this part represents \( x > 7 \).
Step3: Combine the two parts
The compound inequality is the combination of the two parts with "or", so it is \( x \leq 3 \) or \( x > 7 \).

Snap & solve any problem in the app
Get step-by-step solutions on Sovi AI
Photo-based solutions with guided steps
Explore more problems and detailed explanations
\( x \leq 3 \) or \( x > 7 \) (the option with this inequality)