QUESTION IMAGE
Question
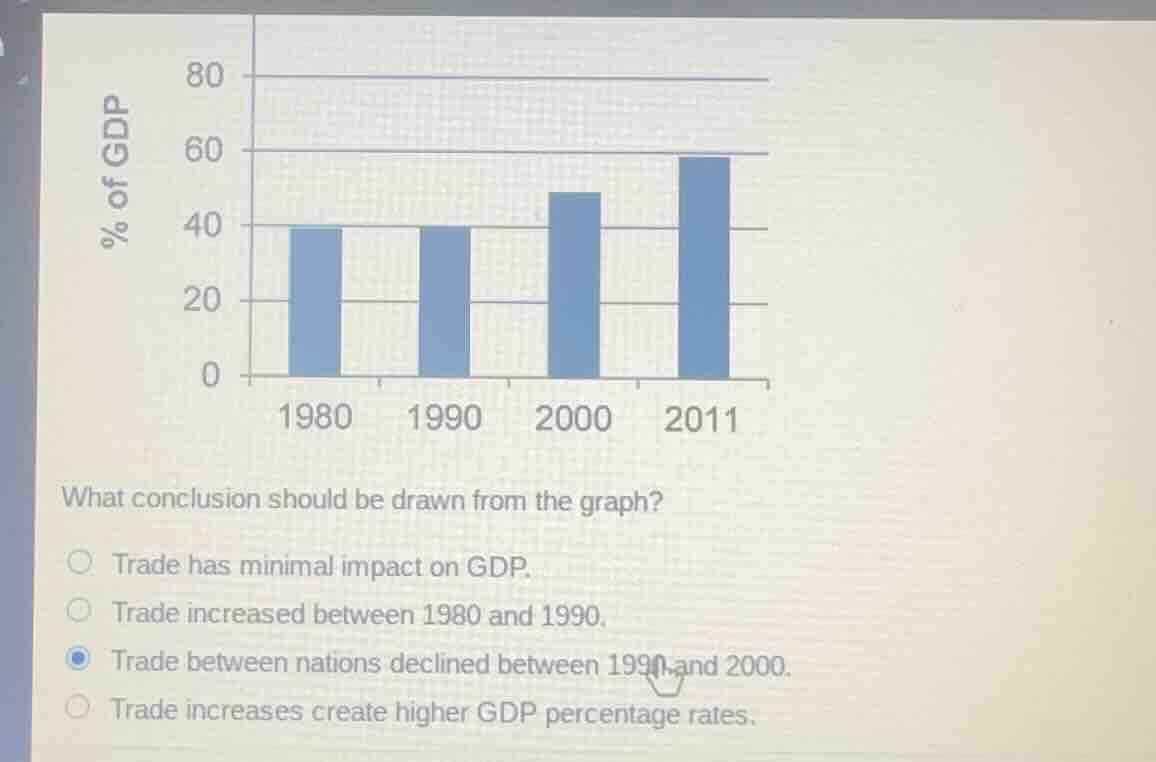
what conclusion should be drawn from the graph? trade has minimal impact on gdp. trade increased between 1980 and 1990. trade between nations declined between 1990 and 2000. trade increases create higher gdp percentage rates.
Brief Explanations
- Evaluate each option against the bar graph:
- Option 1: The graph shows trade as a significant share of GDP (20-60%), so this is false.
- Option 2: The 1980 and 1990 bars are equal, so trade did not increase, making this false.
- Option 3: The 1990 bar is lower than the 2000 bar, so trade rose, not declined, making this false.
- Option 4: The graph shows that as years progress (and trade activity expands globally over this period), the percentage of GDP represented by trade increases consistently (1980=~38%, 1990=~38%, 2000=~48%, 2011=~58%). This matches the statement.

Snap & solve any problem in the app
Get step-by-step solutions on Sovi AI
Photo-based solutions with guided steps
Explore more problems and detailed explanations
Trade increases create higher GDP percentage rates.