QUESTION IMAGE
Question
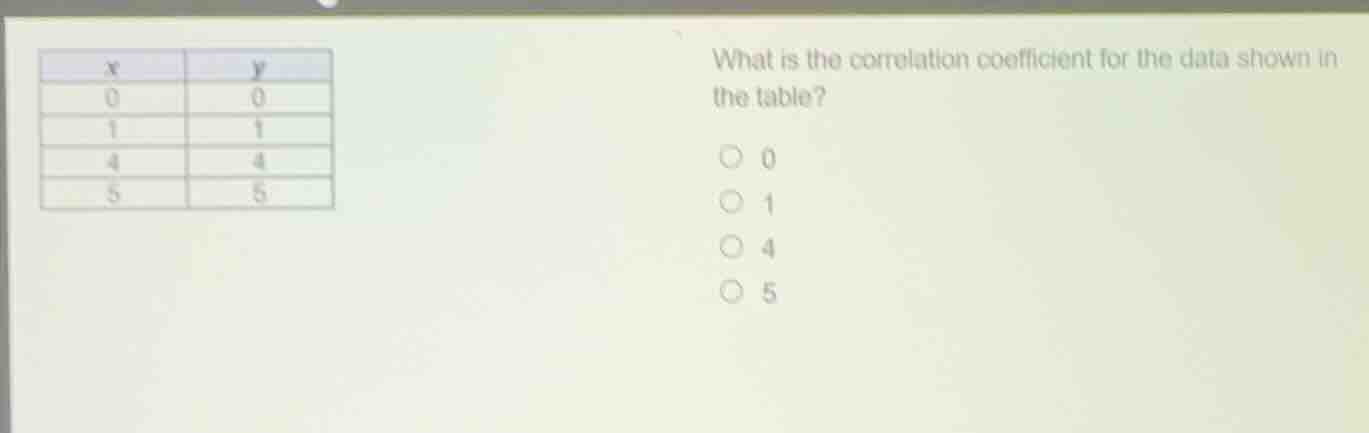
x | y
0 | 0
1 | 1
4 | 4
5 | 5
what is the correlation coefficient for the data shown in the table?
0
1
4
5
Step1: Analyze the relationship between x and y
Looking at the data: when \( x = 0 \), \( y = 0 \); \( x = 1 \), \( y = 1 \); \( x = 4 \), \( y = 4 \); \( x = 5 \), \( y = 5 \). So \( y=x \) for all data points, which means there is a perfect positive linear relationship.
Step2: Recall the correlation coefficient for perfect positive linear relationship
The correlation coefficient \( r \) for a perfect positive linear relationship (where \( y = x \) or \( y = kx \) with \( k>0 \)) is \( 1 \). Values like \( 0 \), \( 4 \), \( 5 \) don't represent correlation coefficients (correlation coefficient ranges between - 1 and 1, and \( 4,5 \) are outside this range, \( 0 \) represents no linear correlation).

Snap & solve any problem in the app
Get step-by-step solutions on Sovi AI
Photo-based solutions with guided steps
Explore more problems and detailed explanations
1 (the option corresponding to 1, i.e., the second option: 1)