QUESTION IMAGE
Question
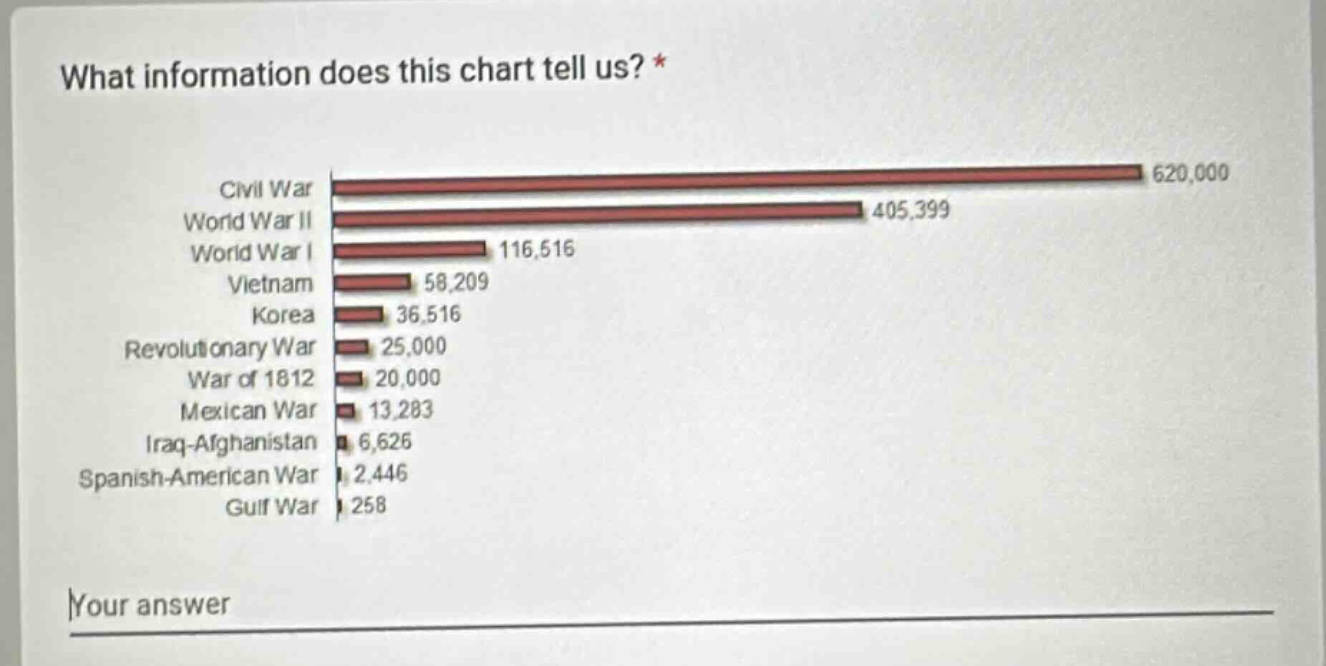
what information does this chart tell us? *
civil war 620,000
world war ii 405,399
world war i 116,516
vietnam 58,209
korea 36,516
revolutionary war 25,000
war of 1812 20,000
mexican war 13,283
iraq - afghanistan 6,626
spanish - american war 2,446
gulf war 258
your answer
This bar chart displays the number of casualties (or related figures) for different wars involving the US. The Civil War has the highest number (620,000), while the Gulf War has the lowest (258). Other wars like WWII (405,399), WWI (116,516), etc., have intermediate values, showing the relative scale of casualties across these conflicts.

Snap & solve any problem in the app
Get step-by-step solutions on Sovi AI
Photo-based solutions with guided steps
Explore more problems and detailed explanations
The bar chart shows the number of (likely) casualties for various US - involved wars. The Civil War had the most (620,000), the Gulf War the least (258), with other wars having intermediate values, illustrating the relative magnitude of casualties across these conflicts.