QUESTION IMAGE
Question
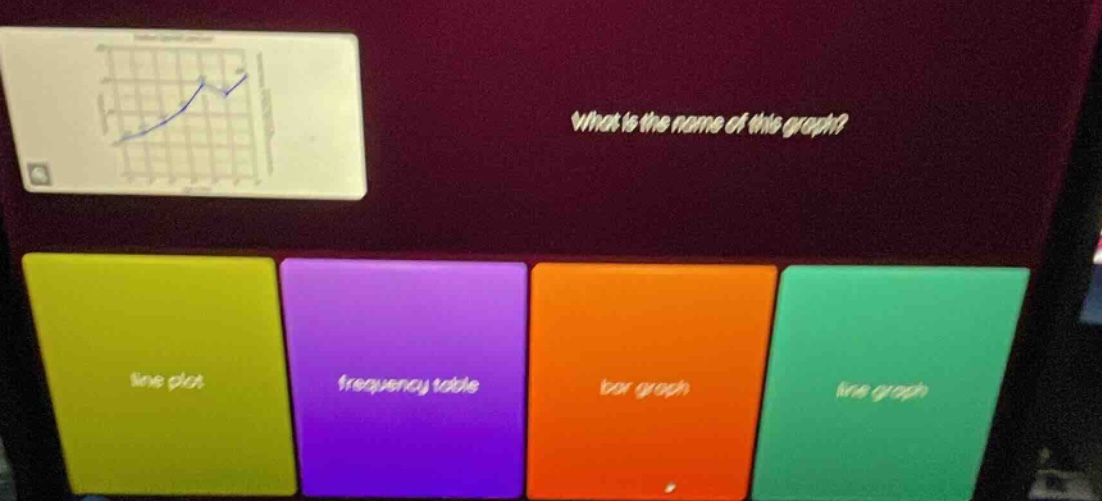
what is the name of this graph? line plot frequency table bar graph line graph
Brief Explanations
The graph shown uses connected line segments to display data points over a grid, which matches the definition of a line graph. A line plot typically shows individual data points on a number line, a frequency table is tabular, and a bar graph uses rectangular bars, so these do not match the visual.

Snap & solve any problem in the app
Get step-by-step solutions on Sovi AI
Photo-based solutions with guided steps
Explore more problems and detailed explanations
D. line graph