QUESTION IMAGE
Question
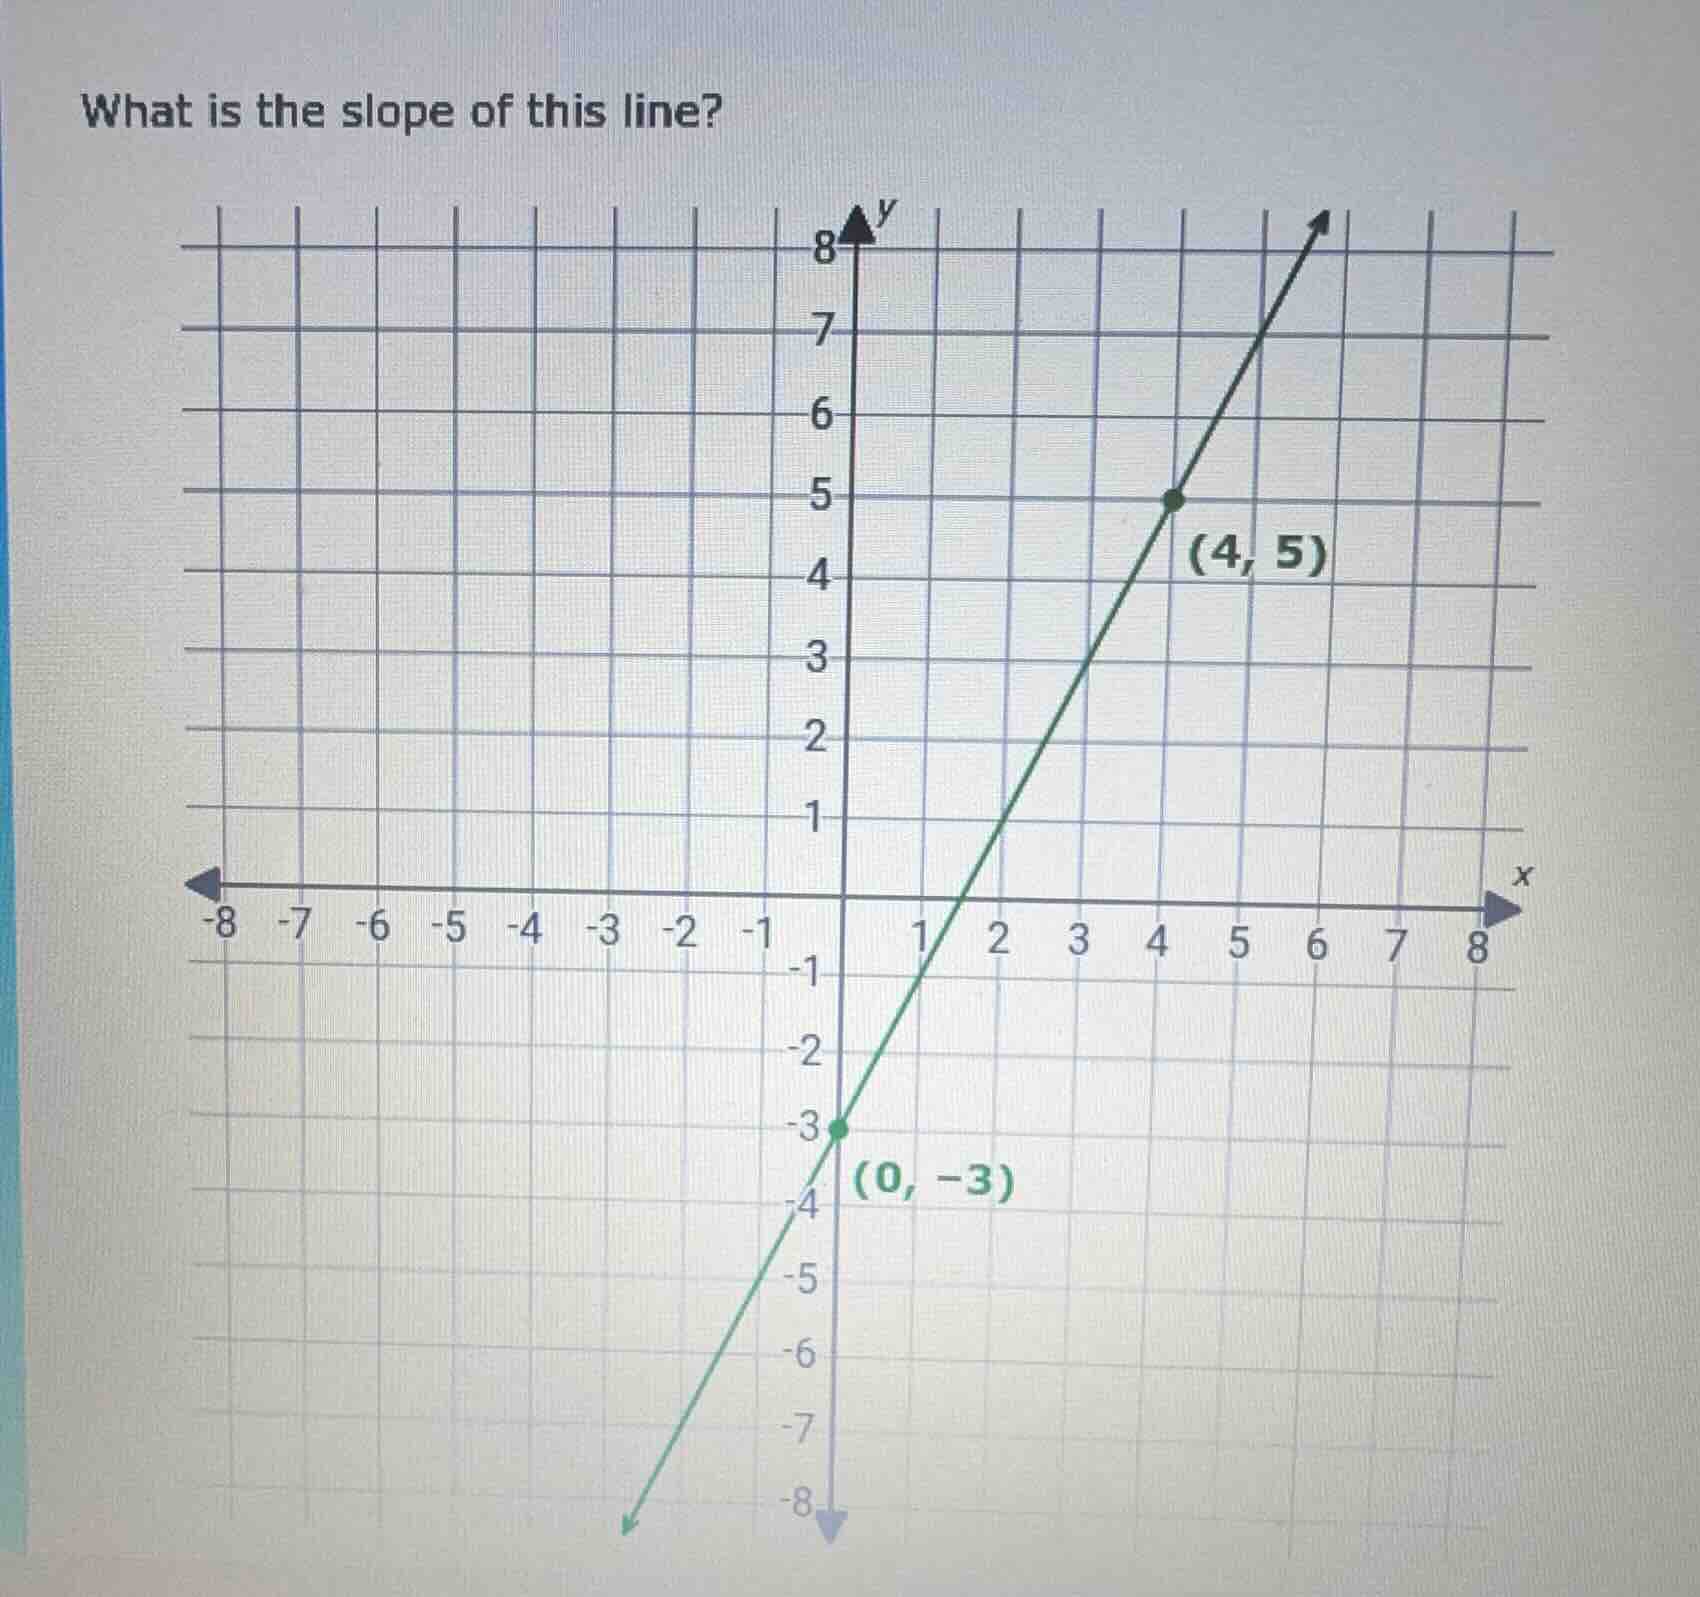
what is the slope of this line? (chart with points (4, 5) and (0, -3))
Step1: Recall slope formula
The slope \( m \) between two points \((x_1, y_1)\) and \((x_2, y_2)\) is \( m = \frac{y_2 - y_1}{x_2 - x_1} \).
Step2: Identify two points
From the graph, we have points \((0, -3)\) (where \( x_1 = 0, y_1 = -3 \)) and \((4, 5)\) (where \( x_2 = 4, y_2 = 5 \)).
Step3: Substitute into formula
Substitute the values into the slope formula: \( m = \frac{5 - (-3)}{4 - 0} \).
Step4: Simplify the expression
Simplify the numerator and denominator: \( 5 - (-3) = 5 + 3 = 8 \), and \( 4 - 0 = 4 \). So \( m = \frac{8}{4} = 2 \).

Snap & solve any problem in the app
Get step-by-step solutions on Sovi AI
Photo-based solutions with guided steps
Explore more problems and detailed explanations
2