QUESTION IMAGE
Question
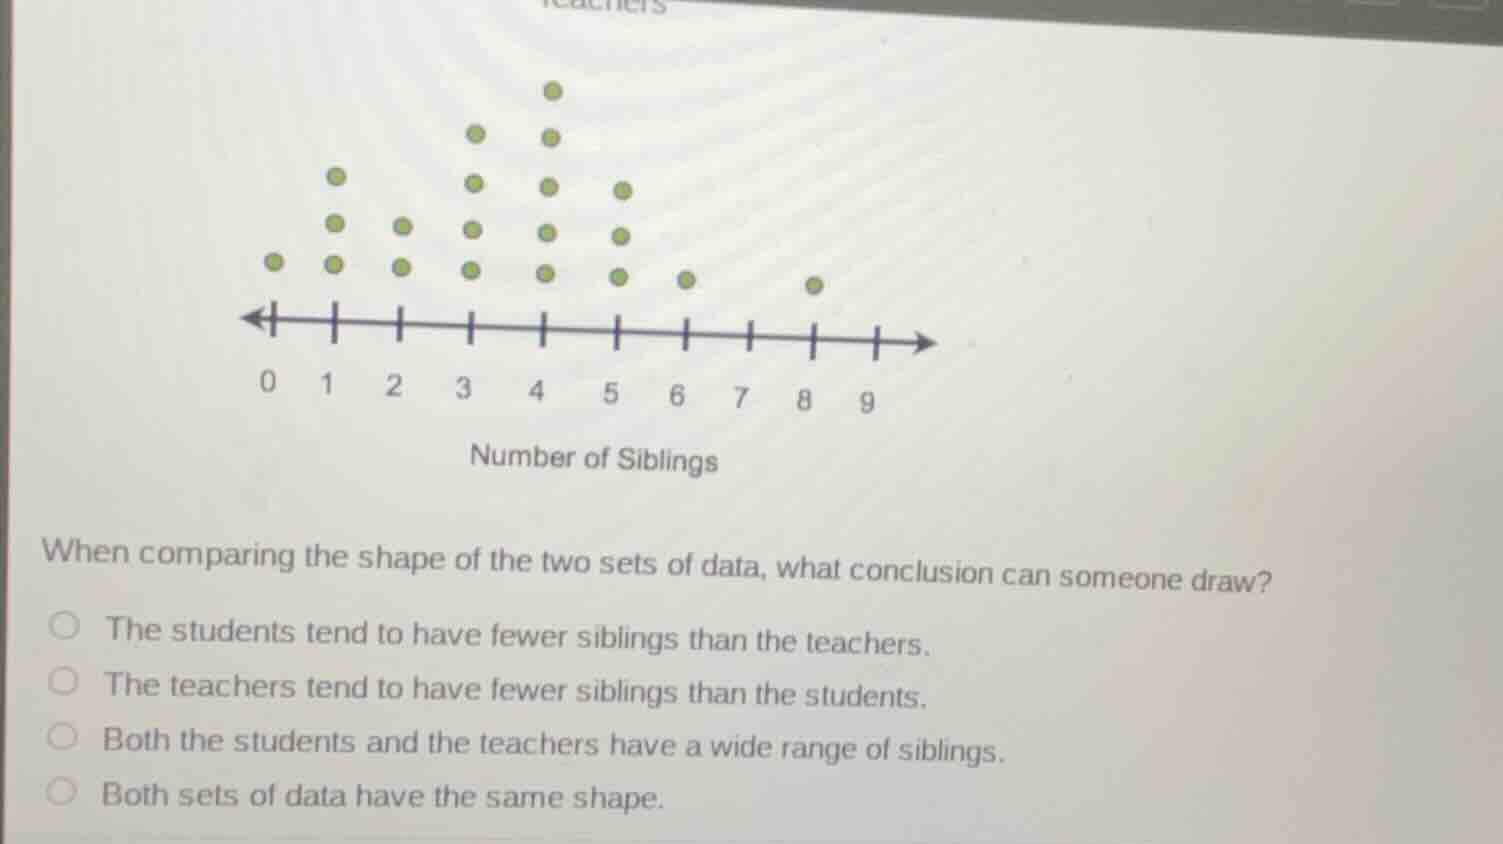
when comparing the shape of the two sets of data, what conclusion can someone draw?
the students tend to have fewer siblings than the teachers.
the teachers tend to have fewer siblings than the students.
both the students and the teachers have a wide range of siblings.
both sets of data have the same shape.
Brief Explanations
First, analyze the dot plot: most data points cluster at lower sibling counts (0-5), with only a few at higher numbers (6,8). This shows the distribution is right-skewed, with most people having fewer siblings. Now evaluate each option:
- There is no separation of student/teacher data in the plot, so we cannot compare the two groups' sibling counts.
- The range of siblings is 0-8, but the data is heavily concentrated at lower values, so it does not have a "wide range" in terms of distribution.
- Since there is only one combined dot plot for both groups, we can conclude their data has the same shape (right-skewed, clustered at lower values).

Snap & solve any problem in the app
Get step-by-step solutions on Sovi AI
Photo-based solutions with guided steps
Explore more problems and detailed explanations
D. Both sets of data have the same shape.