QUESTION IMAGE
Question
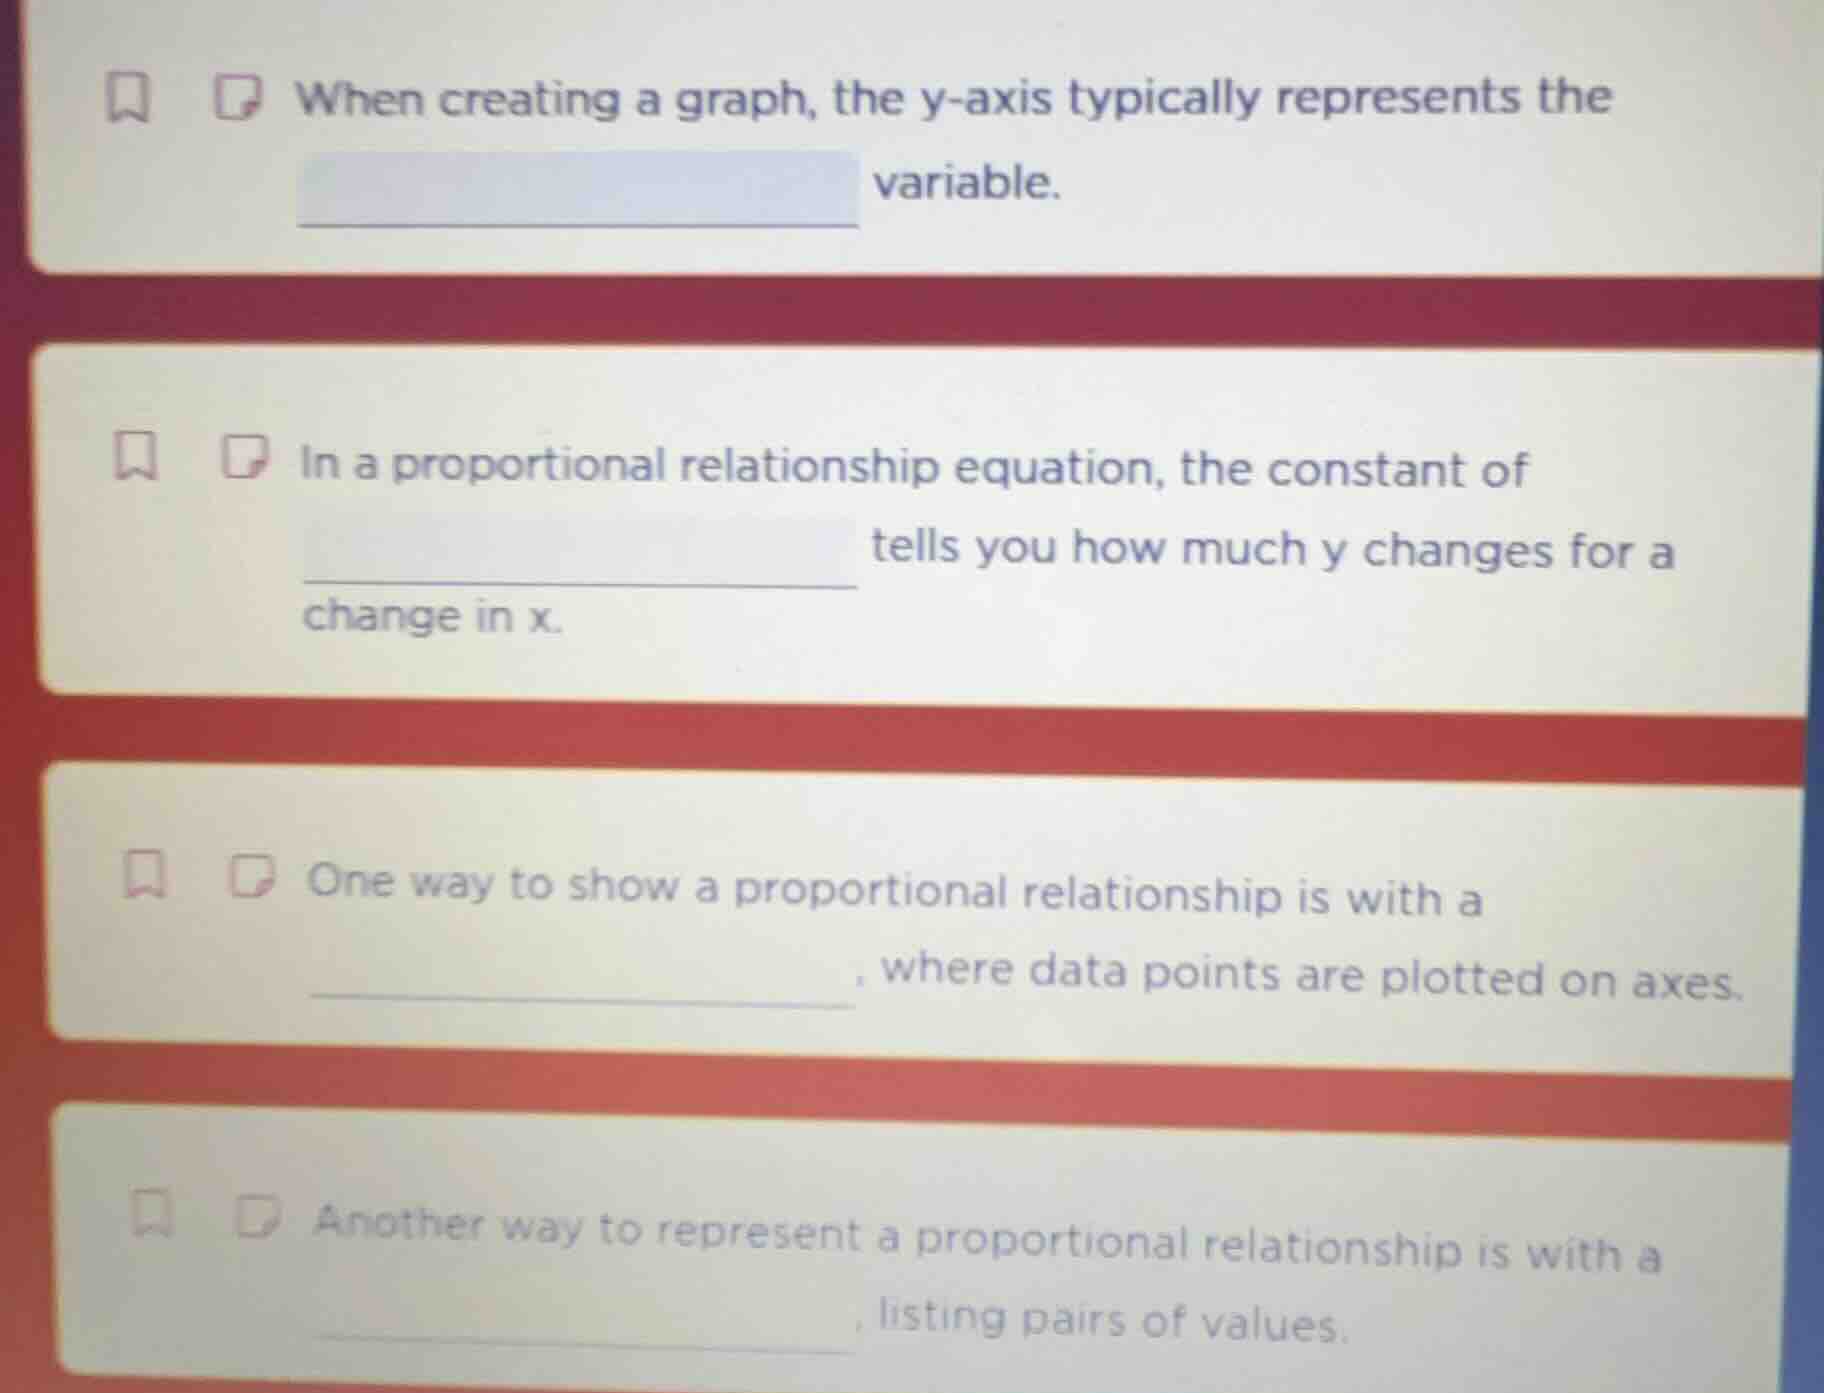
when creating a graph, the y-axis typically represents the
variable.
in a proportional relationship equation, the constant of
tells you how much y changes for a change in x.
one way to show a proportional relationship is with a
, where data points are plotted on axes.
another way to represent a proportional relationship is with a
, listing pairs of values.
First Question:
In graphing, the y - axis is typically used to represent the dependent variable. The dependent variable's value depends on the independent variable (usually on the x - axis). For example, in a graph of distance vs. time, if time is the independent variable (x - axis), distance (dependent on time) is on the y - axis.
In a proportional relationship equation of the form \(y = kx\) (where \(k\) is the constant of proportionality), the constant of proportionality tells us how much \(y\) changes for a unit change in \(x\). For instance, if \(k = 2\), then for every 1 unit increase in \(x\), \(y\) increases by 2 units.
A graph (specifically a scatter plot or a line graph for proportional relationships) is used to show a proportional relationship. In a graph, we plot data points on the x and y axes. For a proportional relationship, the graph is a straight line passing through the origin.

Snap & solve any problem in the app
Get step-by-step solutions on Sovi AI
Photo-based solutions with guided steps
Explore more problems and detailed explanations
dependent