QUESTION IMAGE
Question
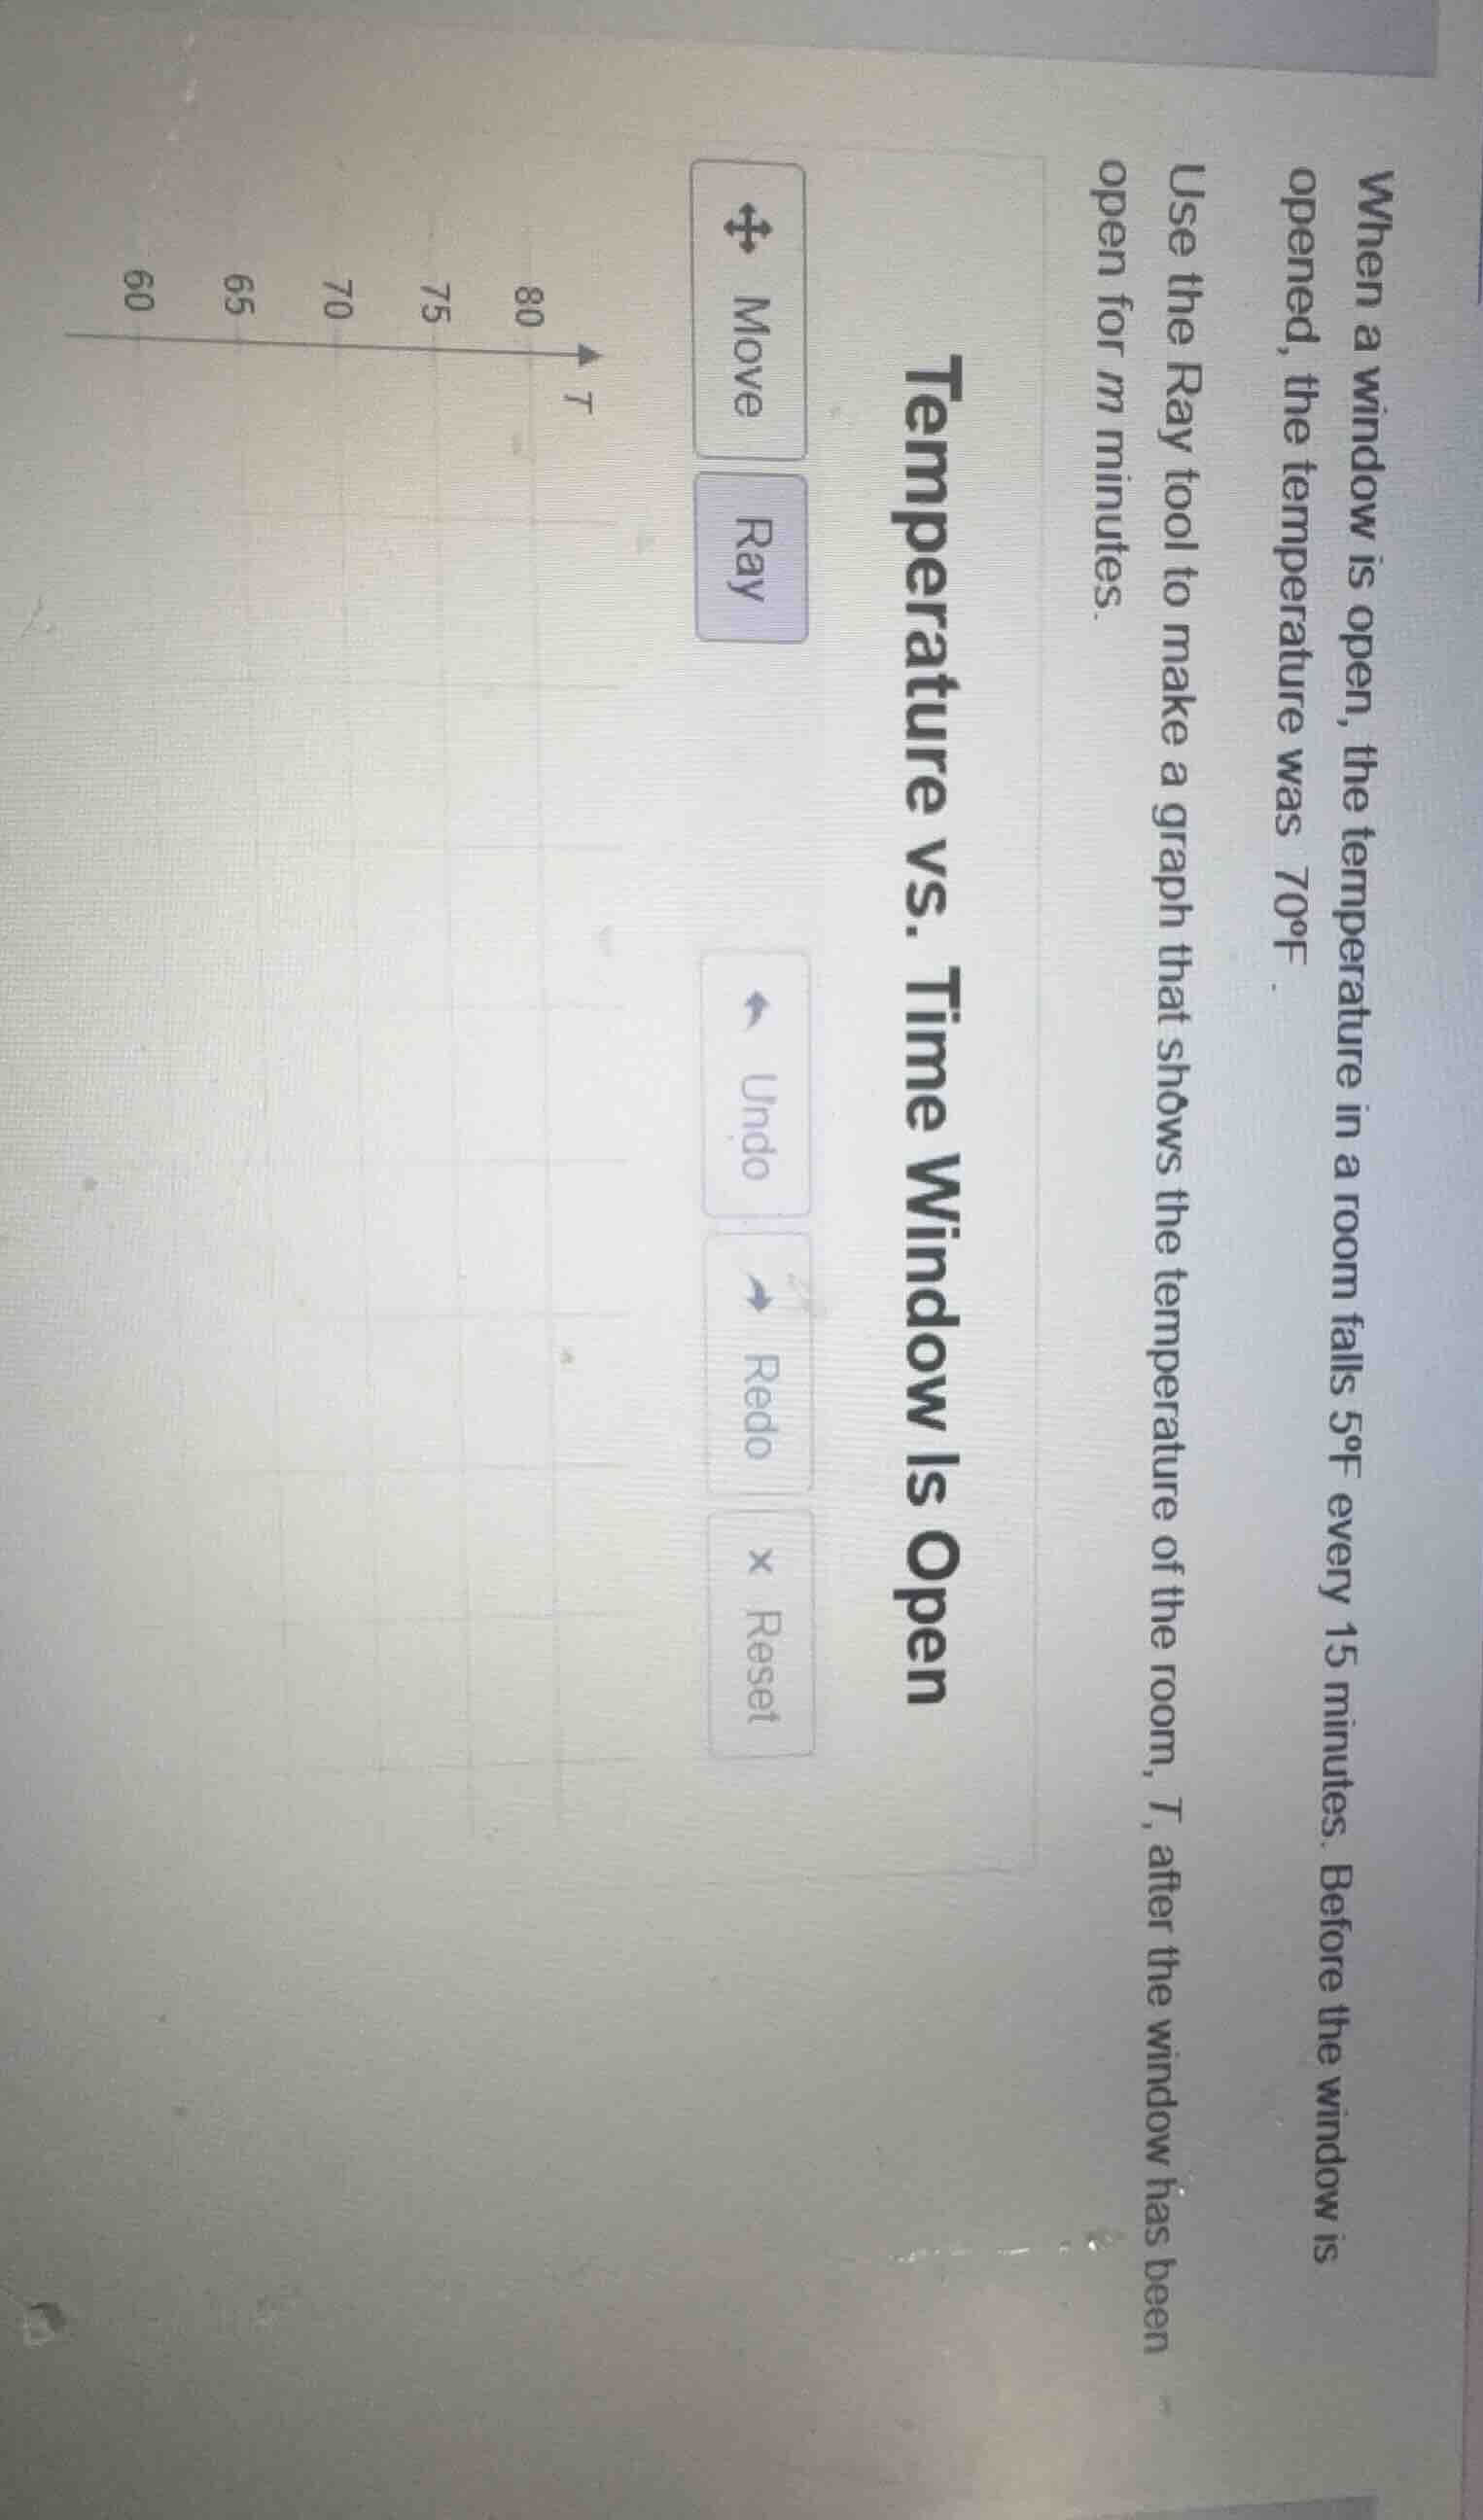
when a window is open, the temperature in a room falls 5°f every 15 minutes. before the window is opened, the temperature was 70°f. use the ray tool to make a graph that shows the temperature of the room, t, after the window has been open for m minutes. temperature vs. time window is open move ray undo redo reset t 80 75 70 65 60
Step1: Define the temperature function
The initial temperature is $70^\circ\text{F}$, and it decreases by $5^\circ\text{F}$ every 15 minutes. The rate of temperature change is $\frac{-5}{15} = -\frac{1}{3}^\circ\text{F per minute}$. The function is:
$$T(m) = 70 - \frac{1}{3}m$$
Step2: Identify key points for graphing
- At $m=0$ (window just opened): $T=70^\circ\text{F}$ → Point $(0, 70)$
- At $m=15$: $T=70-5=65^\circ\text{F}$ → Point $(15, 65)$
- At $m=30$: $T=70-10=60^\circ\text{F}$ → Point $(30, 60)$
Step3: Plot and connect points
Draw a straight line through the points $(0,70)$, $(15,65)$, and $(30,60)$ to represent the linear temperature decrease over time.

Snap & solve any problem in the app
Get step-by-step solutions on Sovi AI
Photo-based solutions with guided steps
Explore more problems and detailed explanations
The graph is a straight line starting at $(0, 70)$, passing through $(15, 65)$ and $(30, 60)$, following the function $T(m) = 70 - \frac{1}{3}m$.