QUESTION IMAGE
Question
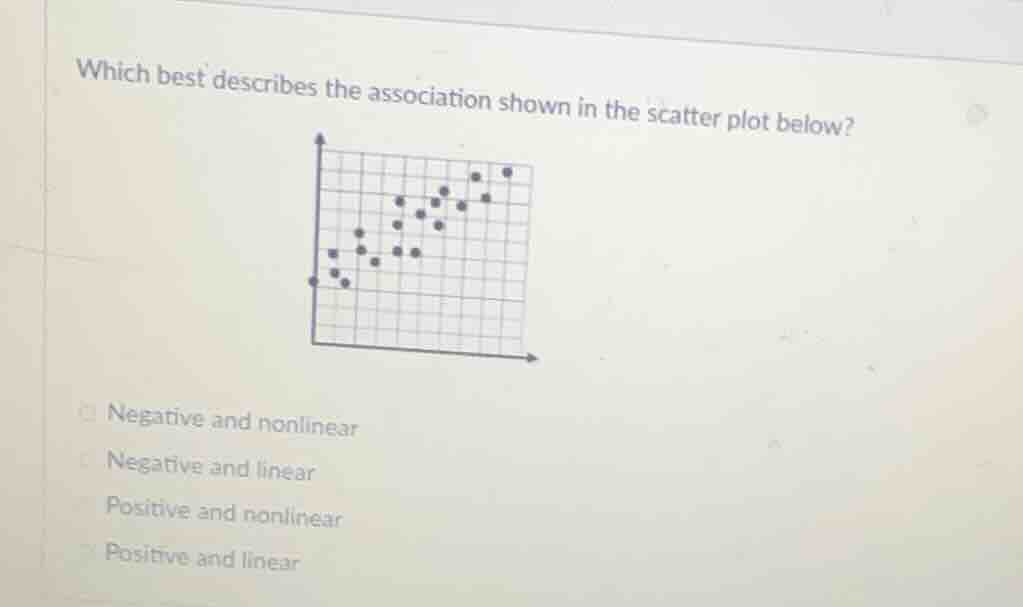
which best describes the association shown in the scatter plot below? negative and nonlinear negative and linear positive and nonlinear positive and linear
Brief Explanations
To determine the association in a scatter plot, we analyze two aspects: direction (positive/negative) and form (linear/nonlinear). A positive association means as one variable increases, the other tends to increase. A linear association has points that roughly follow a straight line.
Looking at the scatter plot:
- Direction: As the x - value (horizontal axis) increases, the y - value (vertical axis) also increases. This indicates a positive association.
- Form: The points appear to lie close to a straight line, suggesting a linear relationship.

Snap & solve any problem in the app
Get step-by-step solutions on Sovi AI
Photo-based solutions with guided steps
Explore more problems and detailed explanations
Positive and linear