QUESTION IMAGE
Question
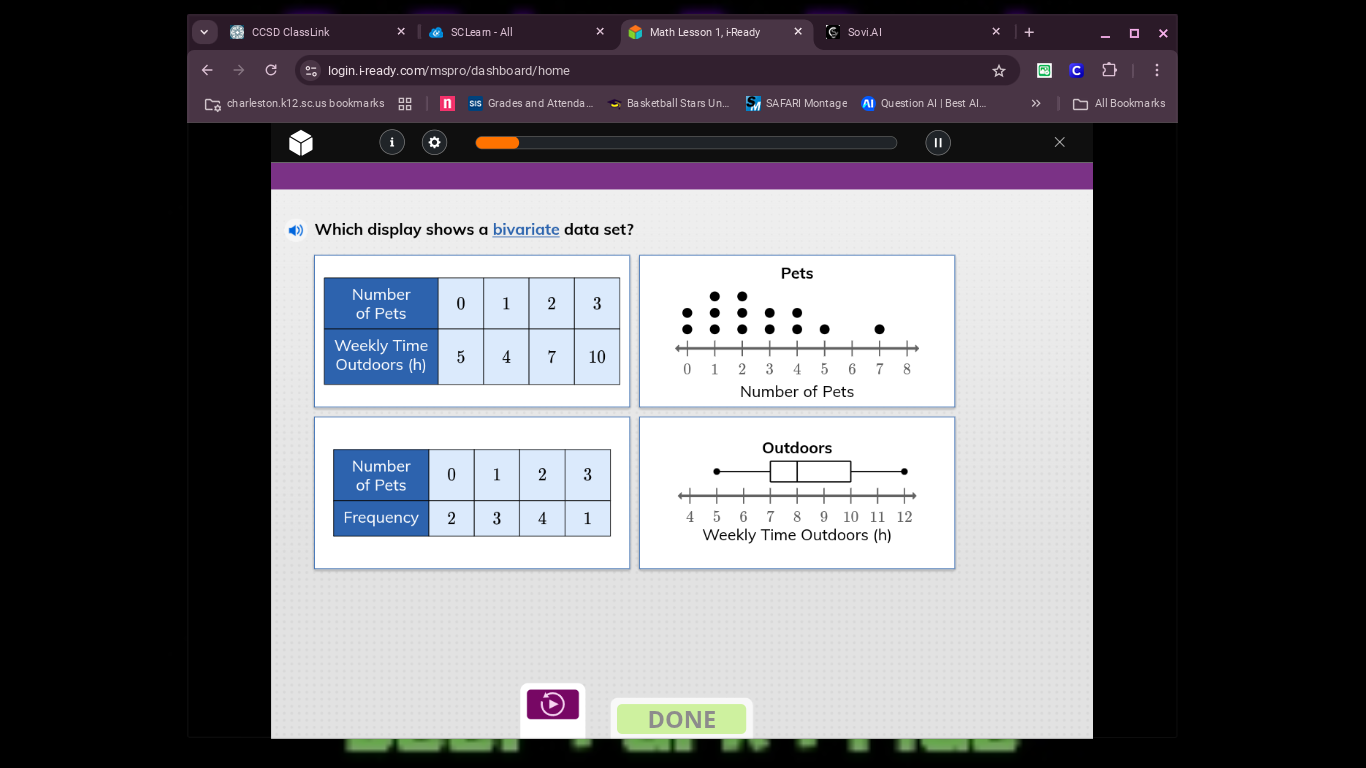
which display shows a bivariate data set?
(charts and tables are shown in the image, including a table with number of pets and weekly time outdoors (h), a dot plot for pets vs number of pets, a table with number of pets and frequency, and a box plot for outdoors vs weekly time outdoors (h))
Step1: Recall bivariate data definition
Bivariate data involves two variables. We check each display:
- Top - left table: Variables "Number of Pets" and "Weekly Time Outdoors (h)" (two variables).
- Top - right dot plot: Variable "Number of Pets" (univariate).
- Bottom - left table: Variable "Number of Pets" and "Frequency" (but frequency is count, still univariate for pets).
- Bottom - right box - plot: Variable "Weekly Time Outdoors (h)" (univariate).
Step2: Identify the bivariate display
The top - left table (and its associated data) has two variables, so it's the bivariate data display. Also, the top - left table's data is bivariate, while others are univariate. The top - left table (first display) shows two variables: number of pets and weekly time outdoors.

Snap & solve any problem in the app
Get step-by-step solutions on Sovi AI
Photo-based solutions with guided steps
Explore more problems and detailed explanations
The top - left table (with columns "Number of Pets" and "Weekly Time Outdoors (h)") (or the first display among the four)