QUESTION IMAGE
Question
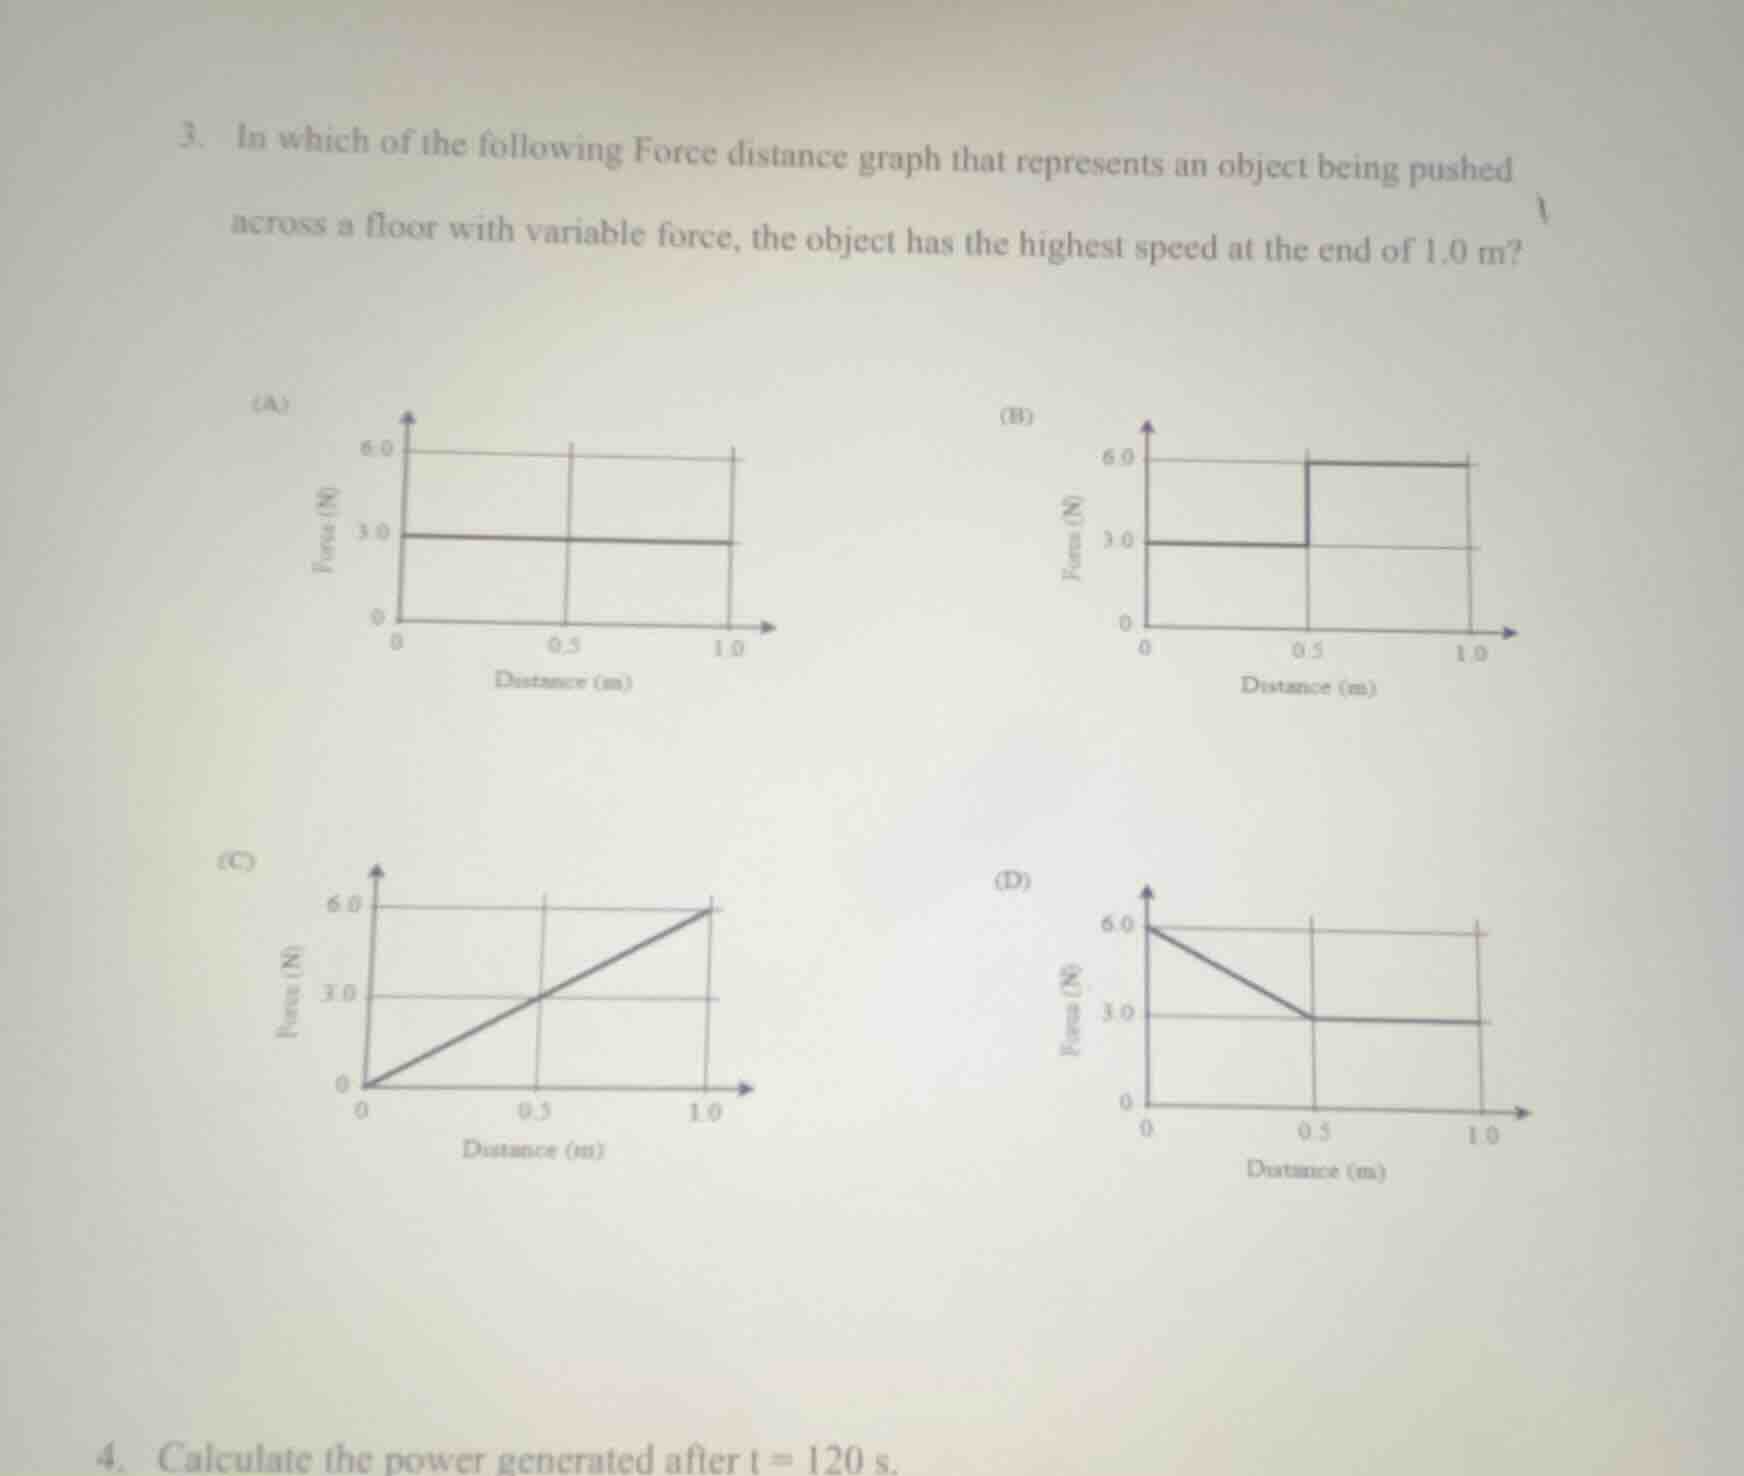
- in which of the following force distance graph that represents an object being pushed across a floor with variable force, the object has the highest speed at the end of 1.0 m?(a)(b)(c)(d)4. calculate the power generated after $t = 120$ s.
Step1: Relate work to speed
By the work-energy theorem, work done $W$ equals change in kinetic energy $\Delta KE = \frac{1}{2}mv^2$. Higher $W$ means higher final speed. Work is the area under the force-distance graph.
Step2: Calculate work for Graph A
Area is rectangle: $W_A = 3.0\ \text{N} \times 1.0\ \text{m} = 3.0\ \text{J}$
Step3: Calculate work for Graph B
Area is two rectangles: $W_B = (3.0\ \text{N} \times 0.5\ \text{m}) + (6.0\ \text{N} \times 0.5\ \text{m}) = 1.5\ \text{J} + 3.0\ \text{J} = 4.5\ \text{J}$
Step4: Calculate work for Graph C
Area is triangle: $W_C = \frac{1}{2} \times 6.0\ \text{N} \times 1.0\ \text{m} = 3.0\ \text{J}$
Step5: Calculate work for Graph D
Area is trapezoid: $W_D = \frac{1}{2} \times (6.0\ \text{N} + 3.0\ \text{N}) \times 0.5\ \text{m} + (3.0\ \text{N} \times 0.5\ \text{m}) = 2.25\ \text{J} + 1.5\ \text{J} = 3.75\ \text{J}$
Step6: Compare work values
$W_B > W_D > W_A = W_C$, so Graph B has highest work, hence highest speed.

Snap & solve any problem in the app
Get step-by-step solutions on Sovi AI
Photo-based solutions with guided steps
Explore more problems and detailed explanations
B. The force-distance graph with 3.0 N from 0 to 0.5 m, and 6.0 N from 0.5 to 1.0 m