QUESTION IMAGE
Question
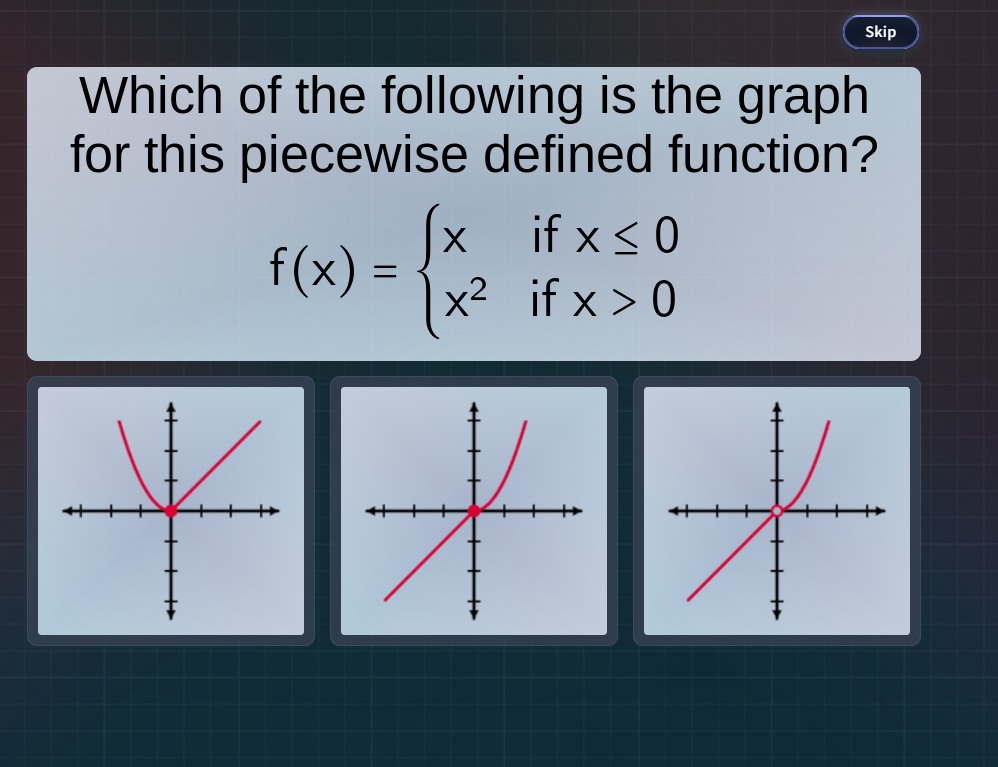
which of the following is the graph for this piecewise defined function?
$f(x) = \
$
Step1: Analyze the first piece \( f(x) = x \) for \( x \leq 0 \)
This is a linear function with a slope of 1. When \( x = 0 \), \( f(0)=0 \). For \( x < 0 \), it's a straight line passing through the origin with a slope of 1, so it should include the point \( (0,0) \) (since \( x \leq 0 \) includes \( x = 0 \)).
Step2: Analyze the second piece \( f(x) = x^2 \) for \( x > 0 \)
This is a quadratic function opening upwards. For \( x > 0 \), we consider the right - hand side of the parabola \( y = x^2 \). At \( x = 0 \), the limit of \( x^2 \) as \( x \) approaches 0 from the right is \( 0^2=0 \), but since the domain for \( x^2 \) is \( x > 0 \), the point \( (0,0) \) is not included in the graph of \( y=x^2 \) for \( x > 0 \), but the graph approaches \( (0,0) \) from the right.
Step3: Compare with the given graphs
- The first graph: The left - hand side is a parabola (which would correspond to \( y = x^2 \) for \( x\leq0 \)), but our first piece is \( y = x \) for \( x\leq0 \), so this graph is incorrect.
- The second graph: The left - hand side is a line with slope 1 passing through the origin (correct for \( y = x, x\leq0 \)) and the right - hand side is the parabola \( y = x^2 \) for \( x > 0 \) with an open circle at \( (0,0) \)? No, wait, the left - hand side includes \( x = 0 \) (since \( x\leq0 \)), so the point \( (0,0) \) should be included in the left - hand line and the right - hand parabola approaches \( (0,0) \). Wait, no, the left - hand function \( f(x)=x \) at \( x = 0 \) is \( f(0) = 0 \), and the right - hand function \( f(x)=x^2 \) at \( x = 0 \) is not included (since \( x>0 \)), but the graph of the left - hand function includes \( (0,0) \). The second graph has a closed circle at \( (0,0) \) for the left - hand line and the right - hand parabola starts at \( (0,0) \)? No, the right - hand function \( x^2 \) for \( x > 0 \) has a graph that starts just to the right of 0. Wait, let's re - examine:
The third graph: The left - hand side is a line with slope 1 (correct for \( y = x, x\leq0 \)) with a closed circle at \( (0,0) \)? No, the third graph has an open circle at \( (0,0) \) for the left - hand line? No, wait the left - hand function \( f(x)=x \) for \( x\leq0 \) includes \( x = 0 \), so the point \( (0,0) \) should be on the left - hand line. The second graph: left - hand line (slope 1, passes through (0,0)) and right - hand parabola ( \( y=x^2,x > 0 \) ) with a closed circle? No, the right - hand function's domain is \( x>0 \), so the point \( (0,0) \) is not in the domain of \( x^2 \) (for \( x > 0 \)), but the left - hand function's domain includes \( x = 0 \). Wait, maybe I made a mistake. Let's check the three graphs again.
Wait, the function is:
- For \( x\leq0 \), \( y=x \): this is a straight line with slope 1, passing through the origin, and including the point \( (0,0) \) (since \( x = 0 \) is in the domain).
- For \( x>0 \), \( y=x^2 \): this is a parabola opening upwards, with the point \( (0,0) \) not included (since \( x>0 \)), but the graph approaches \( (0,0) \) from the right.
The second graph: The left - hand line is \( y = x \) with \( x\leq0 \) (includes \( (0,0) \), closed circle) and the right - hand parabola \( y=x^2 \) with \( x > 0 \) (open circle at \( (0,0) \))? No, the second graph has a closed circle at \( (0,0) \) for the right - hand parabola? No, looking at the graphs:
- First graph: symmetric about y - axis, left and right both parabola (wrong, left should be line).
- Second graph: left is line (slope 1, through (0,0), closed circle), right is parabola (starts at (…

Snap & solve any problem in the app
Get step-by-step solutions on Sovi AI
Photo-based solutions with guided steps
Explore more problems and detailed explanations
The second graph (the middle one)