QUESTION IMAGE
Question
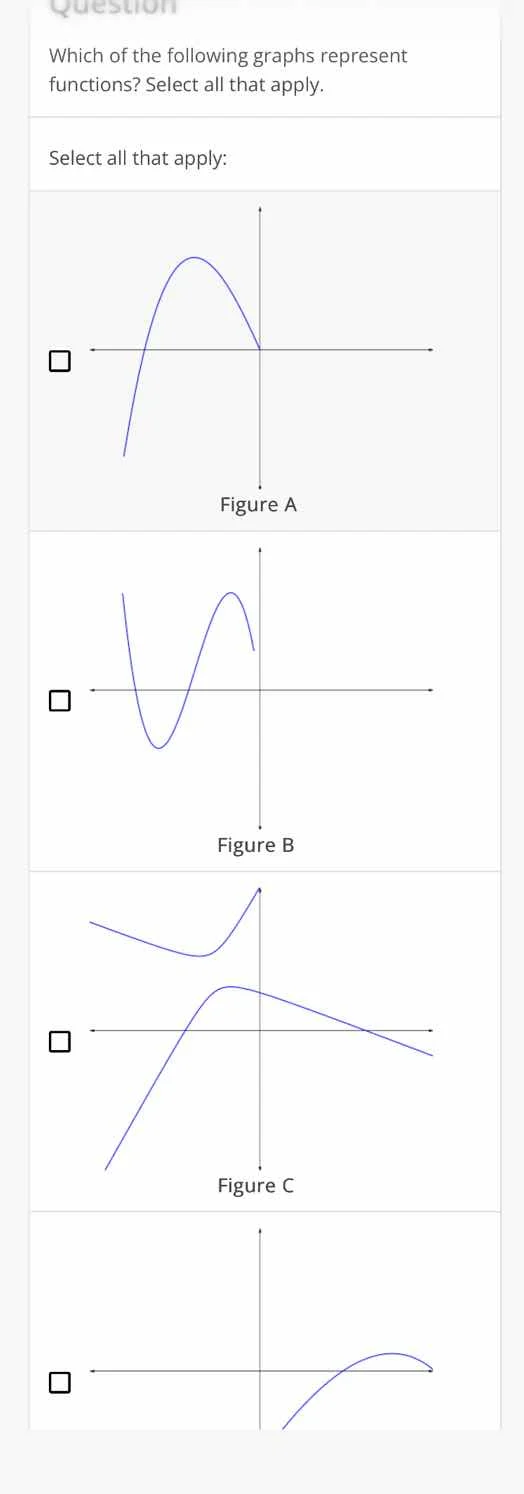
which of the following graphs represent functions? select all that apply.
select all that apply:
figure a
figure b
figure c
Step1: Apply Vertical Line Test
A graph represents a function if any vertical line drawn intersects it at most once.
Step2: Check Figure A
Any vertical line cuts the curve at 1 point. It passes the test.
Step3: Check Figure B
Any vertical line cuts the curve at 1 point. It passes the test.
Step4: Check Figure C
A vertical line can cut the 2 curves at 2 points. It fails the test.
Step5: Check Figure D
Any vertical line cuts the curve at 1 point. It passes the test.

Snap & solve any problem in the app
Get step-by-step solutions on Sovi AI
Photo-based solutions with guided steps
Explore more problems and detailed explanations
Figure A, Figure B, Figure D