QUESTION IMAGE
Question
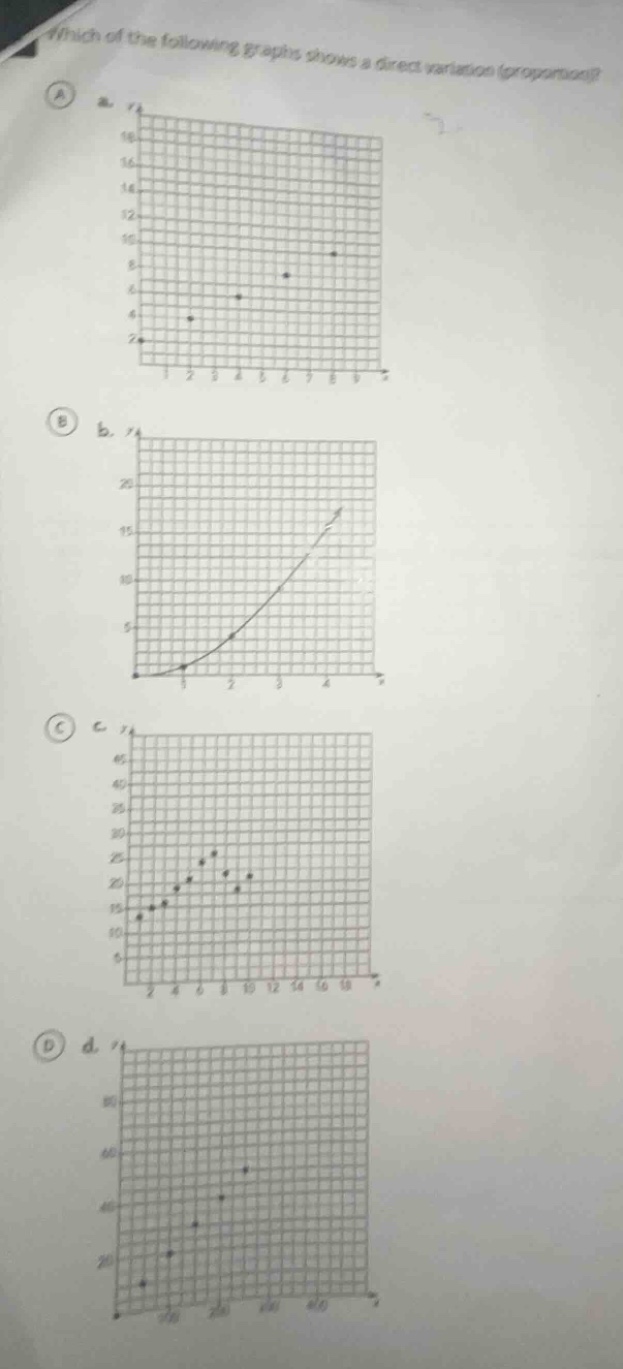
which of the following graphs shows a direct variation (proportion)?
Brief Explanations
Direct variation (proportion) is defined by the relationship $y = kx$ where $k$ is a non-zero constant. This relationship graphs as a straight line that passes through the origin $(0,0)$, with all points lying exactly on this line, meaning the ratio $\frac{y}{x}$ is constant for all non-zero $x$.
- Option A: The points are scattered and do not form a straight line through the origin.
- Option B: The graph is a curve, not a straight line, so it does not represent direct variation.
- Option C: The points are scattered and do not follow a straight line through the origin.
- Option D: The points lie perfectly on a straight line that passes through the origin, satisfying $y = kx$ with a constant ratio of $\frac{y}{x}$.

Snap & solve any problem in the app
Get step-by-step solutions on Sovi AI
Photo-based solutions with guided steps
Explore more problems and detailed explanations
D. (The graph where points lie on a straight line passing through the origin)