QUESTION IMAGE
Question
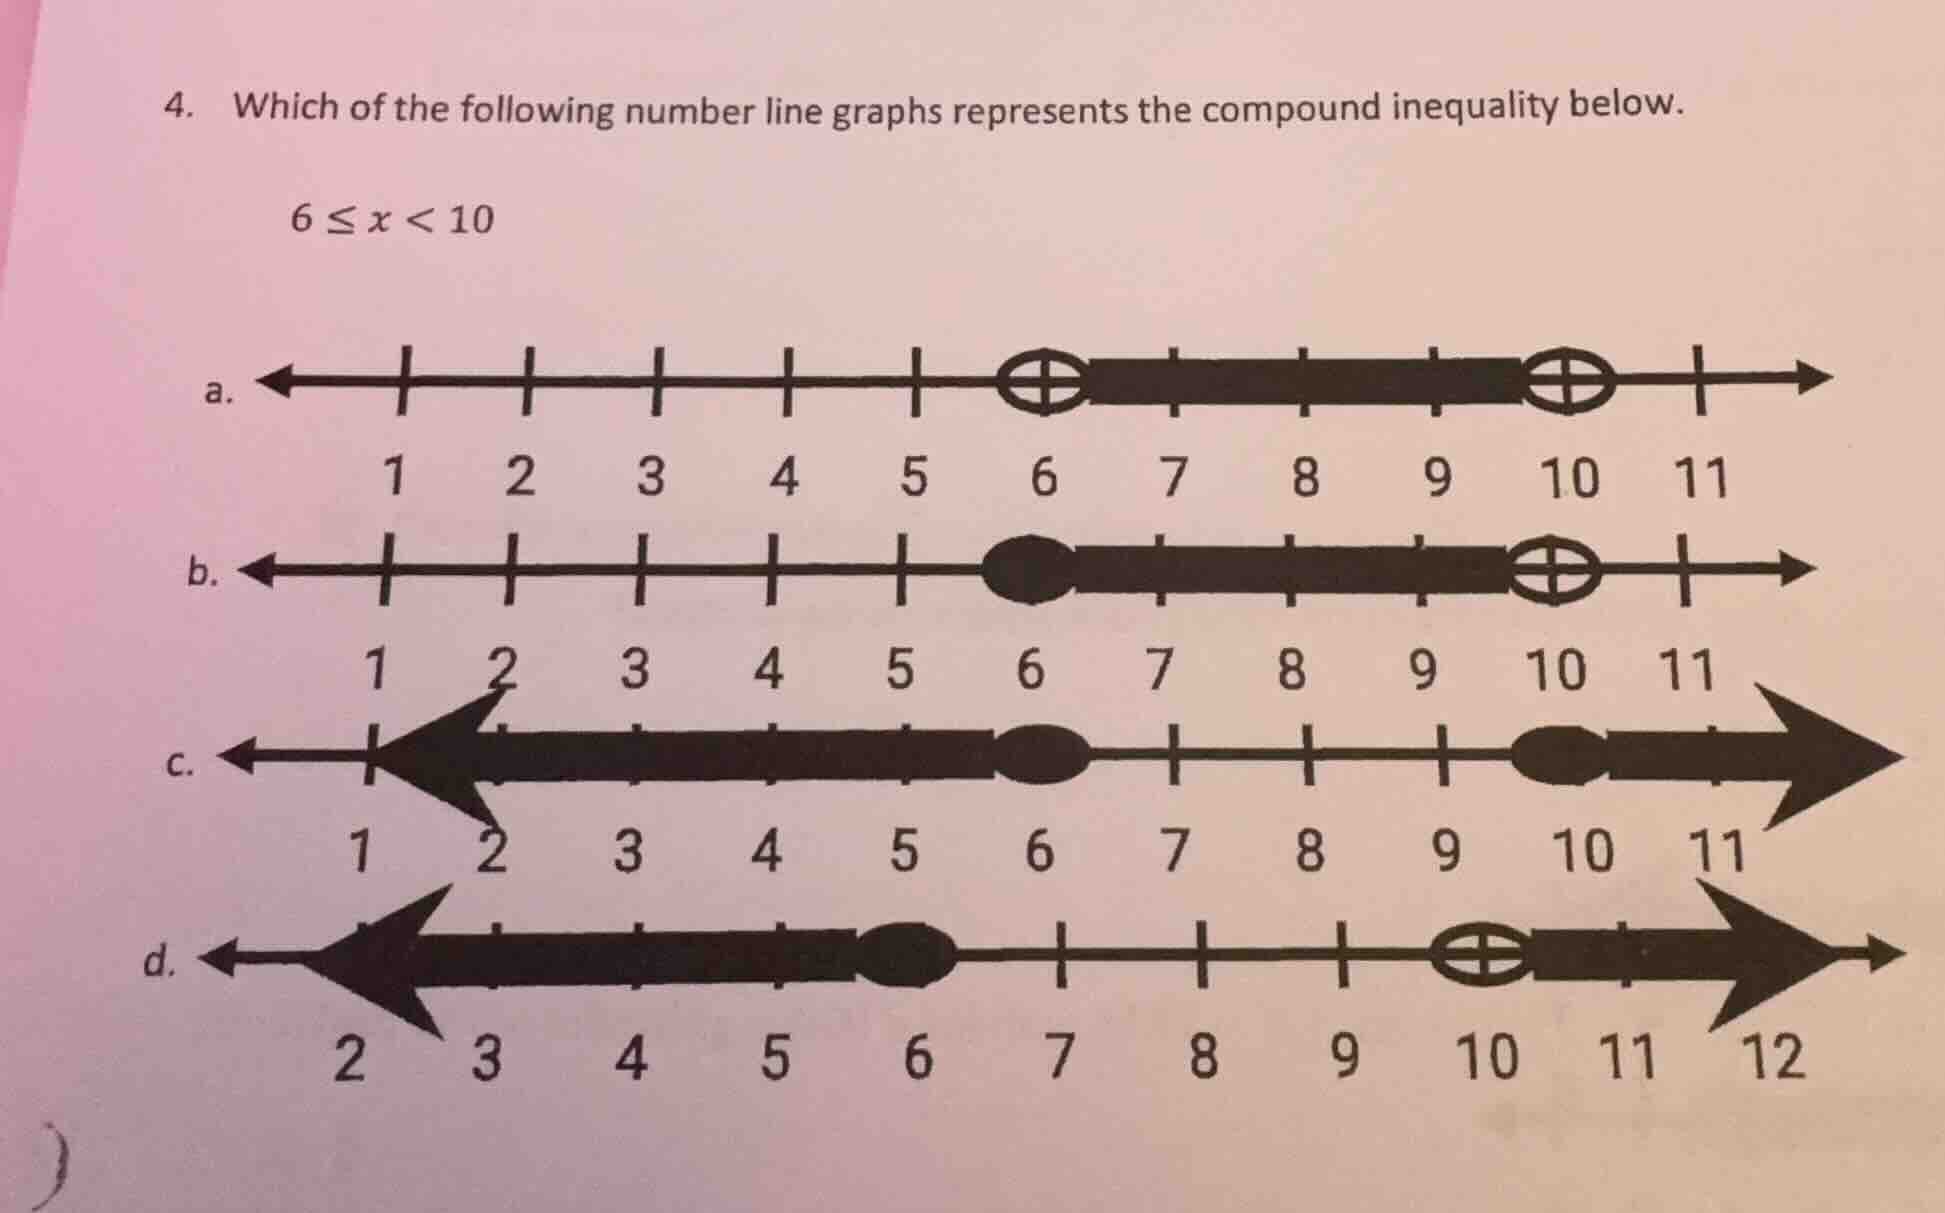
- which of the following number line graphs represents the compound inequality below.
$6 \leq x < 10$
a. number line with open circles at 6 and 10, shaded between
b. number line with closed circle at 6 and open circle at 10, shaded between
c. number line with closed circle at 6 and closed circle at 10, shaded outside
d. number line with closed circle at 6 and open circle at 10, shaded outside
Step1: Analyze left inequality
$6 \leq x$ means 6 is included, so use a closed dot at 6.
Step2: Analyze right inequality
$x < 10$ means 10 is excluded, so use an open dot at 10.
Step3: Identify the interval
Shade the region between 6 and 10.

Snap & solve any problem in the app
Get step-by-step solutions on Sovi AI
Photo-based solutions with guided steps
Explore more problems and detailed explanations
b. <The number line with a closed dot at 6, open dot at 10, and shaded region between them>