QUESTION IMAGE
Question
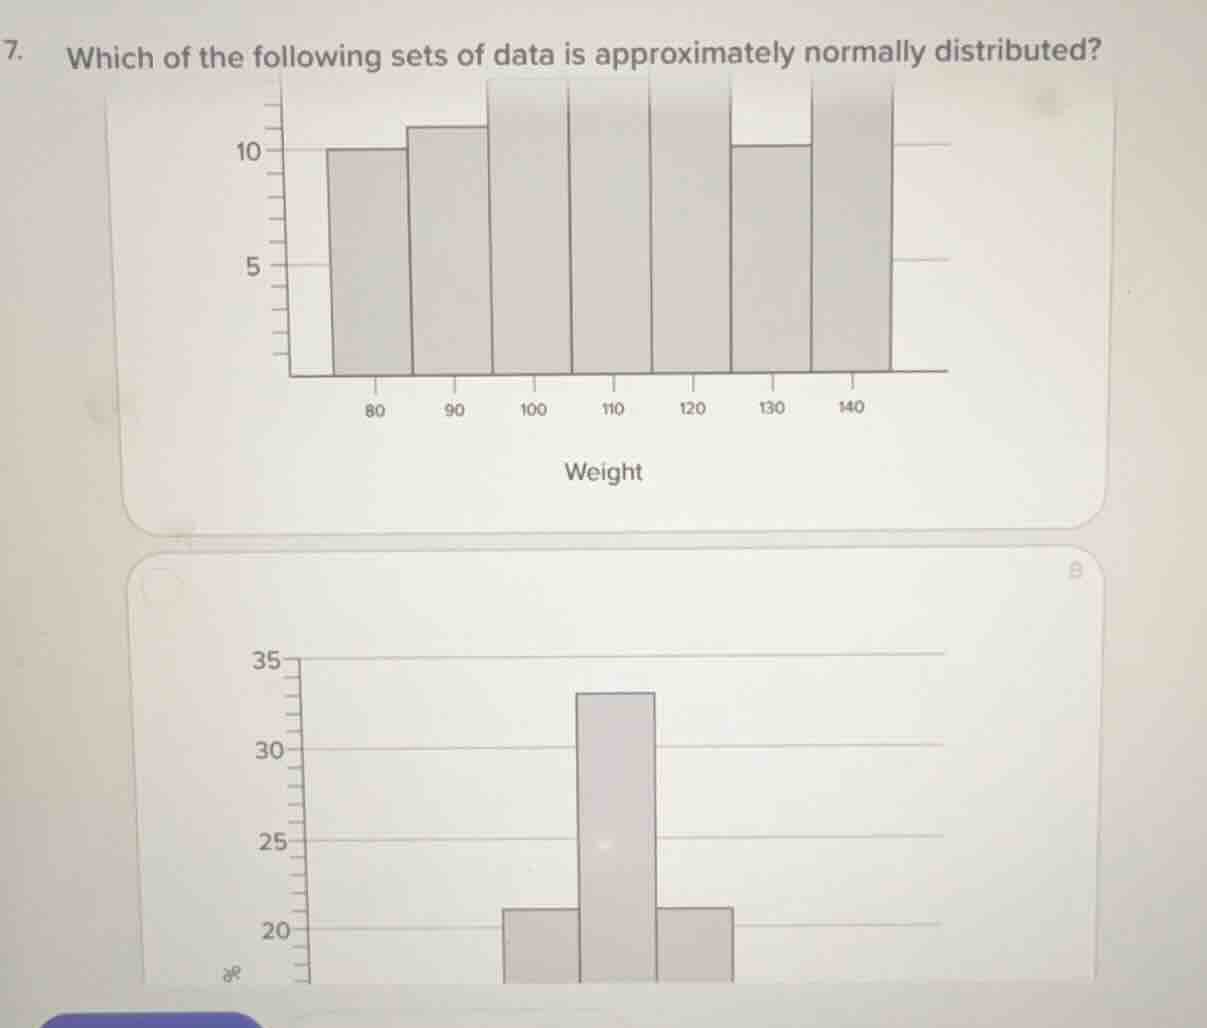
- which of the following sets of data is approximately normally distributed? (there are two bar charts, the first ones x - axis is weight with values 80, 90, 100, 110, 120, 130, 140, and the y - axis has markings 5, 10; the second chart has a y - axis with markings 20, 25, 30, 35)
To determine which data set is approximately normally distributed, we recall the properties of a normal distribution: it is symmetric, bell - shaped, with most data around the mean and tapering off on both sides.
Analyze the first histogram (Weight):
- The bars increase from 80 to 110 - 120 (the middle range) and then decrease from 110 - 120 to 140. But the right - hand side (around 140) has a bar that is as tall as the middle bars, which breaks the symmetry of a normal distribution. Wait, actually, maybe we mis - analyze. Wait, no, let's look again. Wait, the first histogram: the x - axis is weight (80, 90, 100, 110, 120, 130, 140). The heights of the bars: at 80, it's 10; 90, a bit more than 10; 100, more; 110, same as 100; 120, same as 100, 110; 130, 10; 140, more than 10. This is not symmetric. Wait, maybe the second histogram is not fully shown. Wait, the second histogram has three bars. The middle bar is the tallest, and the two side bars are equal in height. This is symmetric and has a single peak (unimodal), which is characteristic of a normal distribution (or at least approximately normal). The first histogram does not show a symmetric, unimodal distribution with the peak in the middle and tapering off on both sides.
A normal distribution is symmetric, unimodal (one peak), and tapers off on both sides of the mean. The second data set (from the lower histogram) has a single peak in the middle and equal - height bars on either side, showing symmetry. The first data set does not have this symmetric, unimodal shape.

Snap & solve any problem in the app
Get step-by-step solutions on Sovi AI
Photo-based solutions with guided steps
Explore more problems and detailed explanations
The data set represented by the lower histogram (with three bars, middle bar tallest and side bars equal) is approximately normally distributed.