QUESTION IMAGE
Question
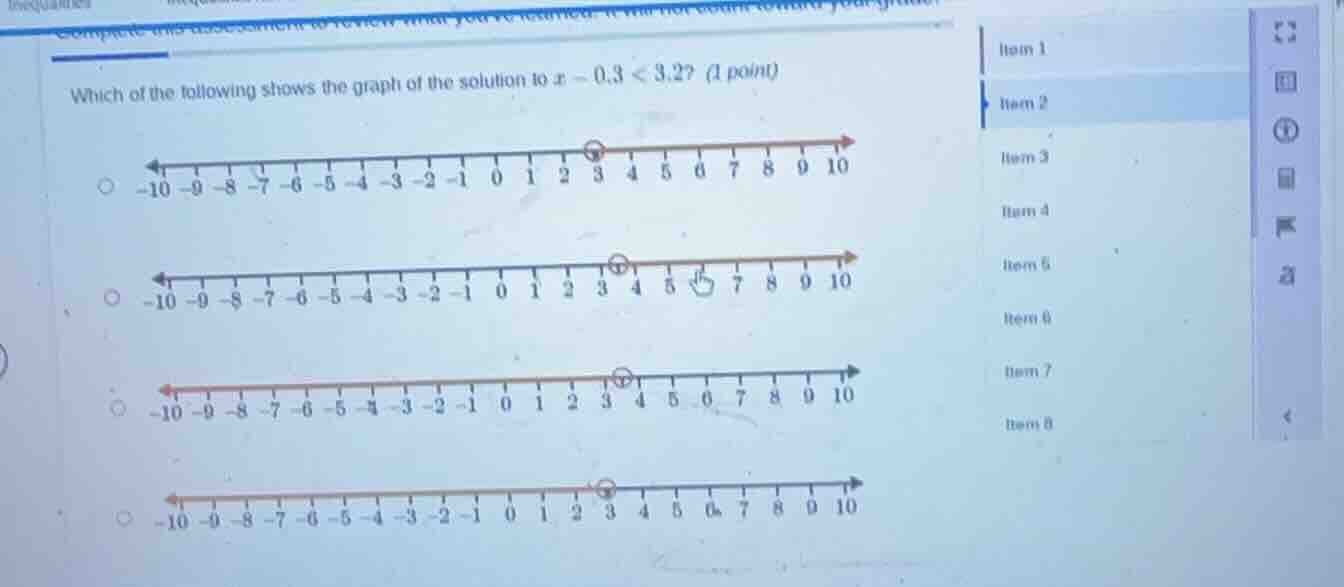
which of the following shows the graph of the solution to ( x - 0.3 < 3.2 )? (1 point)
Step1: Isolate the variable x
Add 0.3 to both sides of the inequality to solve for x.
$x - 0.3 + 0.3 < 3.2 + 0.3$
Step2: Calculate the right-hand side
Simplify the expression to find the solution range.
$x < 3.5$
Step3: Match to number line
A solution of $x < 3.5$ means an open circle at 3.5 (since the inequality is strict, not "less than or equal to") and an arrow pointing left to represent all values smaller than 3.5.

Snap & solve any problem in the app
Get step-by-step solutions on Sovi AI
Photo-based solutions with guided steps
Explore more problems and detailed explanations
The correct graph is the third option: an open circle at 3.5 on the number line, with a red arrow extending left towards negative infinity.