QUESTION IMAGE
Question
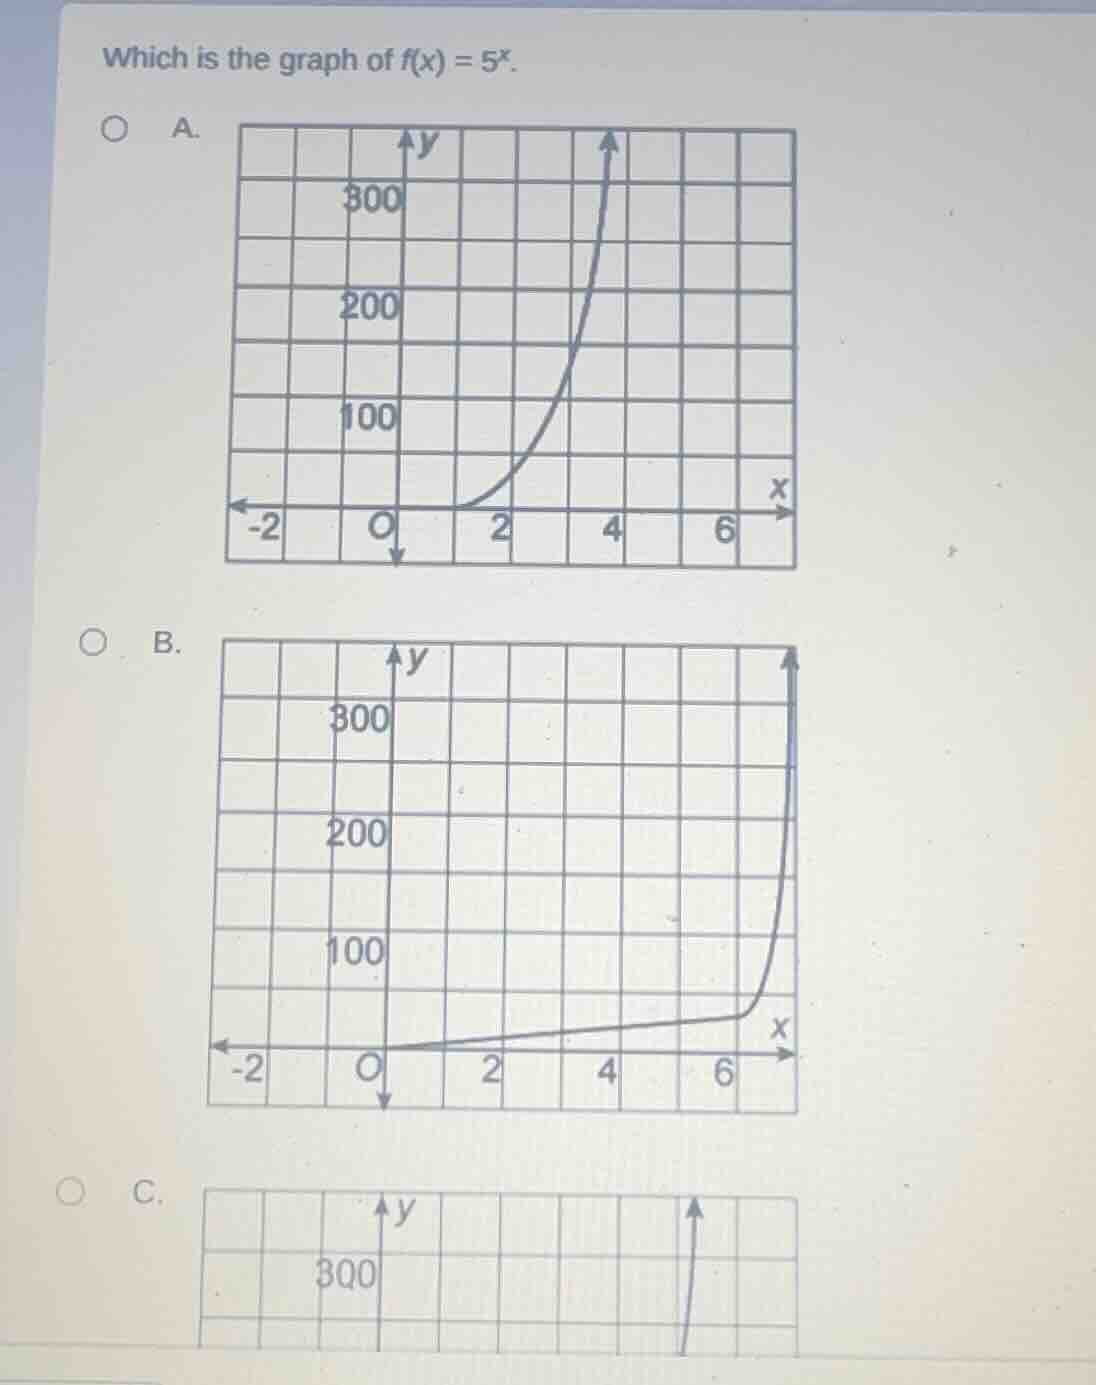
which is the graph of $f(x) = 5^x$.\
\
\\(\bigcirc\\) a.\
\
\\(\bigcirc\\) b.\
\
\\(\bigcirc\\) c.
Step1: Analyze the function \( f(x) = 5^x \)
The function \( f(x)=5^x \) is an exponential function with base \( 5>1 \), so it should be an increasing exponential curve. Let's check some key points:
- When \( x = 0 \), \( f(0)=5^0 = 1 \).
- When \( x = 1 \), \( f(1)=5^1 = 5 \).
- When \( x = 2 \), \( f(2)=5^2 = 25 \).
- When \( x = 3 \), \( f(3)=5^3 = 125 \).
- When \( x = 4 \), \( f(4)=5^4 = 625 \) (but 625 is greater than 300, so at \( x = 4 \), the \( y \)-value should be above 300? Wait, no, let's check the graphs. Wait, maybe the grid is different. Wait, let's check the options:
For option A: At \( x = 2 \), \( y \) is around, say, when \( x = 2 \), the curve is at \( y \approx 25 \)? Wait no, maybe the grid lines: Let's see the x-axis: from -2 to 6, y-axis from 0 to 300. Wait, when \( x = 2 \), \( 5^2=25 \), \( x = 3 \), \( 125 \), \( x = 4 \), \( 625 \) (but 625 is more than 300, so the graph at \( x = 4 \) should be above 300? Wait, maybe the graphs are scaled. Wait, option A: the curve starts near \( x = 1 \) or 2, then rises. Wait, no, exponential function \( 5^x \) passes through (0,1), (1,5), (2,25), (3,125), (4,625). Let's check the options:
Option A: The curve starts at around \( x = 1 \) or 2, then rises. At \( x = 4 \), it's above 300? Wait, 5^4=625, which is more than 300. Option B: The curve is flat until \( x = 6 \), then rises, which is not exponential growth (exponential growth should be increasing throughout, with increasing slope). Option A: Let's check the key points. At \( x = 0 \), \( f(0)=1 \), so the graph should be near \( y = 1 \) when \( x = 0 \). Wait, maybe the graph is shifted? No, \( f(x)=5^x \) has \( y \)-intercept at (0,1). Let's check the graphs:
Option A: The curve starts at around \( x = 1 \) or 2, but actually, for \( x = 0 \), \( y = 1 \), so the graph should be close to the x-axis (since \( y = 1 \) is near 0) when \( x = 0 \), then rise. Option A: At \( x = 0 \), the graph is near \( y = 0 \), then at \( x = 2 \), \( y \) is around, say, 25 (since \( 5^2=25 \)), then at \( x = 3 \), 125, \( x = 4 \), 625 (which is above 300). So option A's graph: at \( x = 4 \), it's above 300, which matches \( 5^4 = 625 \). Option B: The graph is flat until \( x = 6 \), then rises, which is not exponential (exponential growth has increasing slope from the start). So the correct graph should be option A.
Wait, maybe I made a mistake. Let's re-express:
Exponential function \( f(x) = 5^x \) is an exponential growth function (base > 1). So it should be increasing, with the slope increasing as \( x \) increases. Let's check the options:
- Option A: The curve starts near the x-axis (since \( y = 1 \) at \( x = 0 \) is near 0), then rises, with increasing steepness. At \( x = 2 \), \( y = 25 \) (which is on the graph), \( x = 3 \), \( y = 125 \), \( x = 4 \), \( y = 625 \) (above 300). This matches.
- Option B: The curve is almost flat until \( x = 6 \), then rises, which is not exponential growth (exponential growth should be increasing from \( x = -\infty \) to \( \infty \), with the slope increasing).
- Option C: The curve is vertical, which is not a function.
So the correct graph is option A.

Snap & solve any problem in the app
Get step-by-step solutions on Sovi AI
Photo-based solutions with guided steps
Explore more problems and detailed explanations
A. The graph of \( f(x) = 5^x \) (the first graph)