QUESTION IMAGE
Question
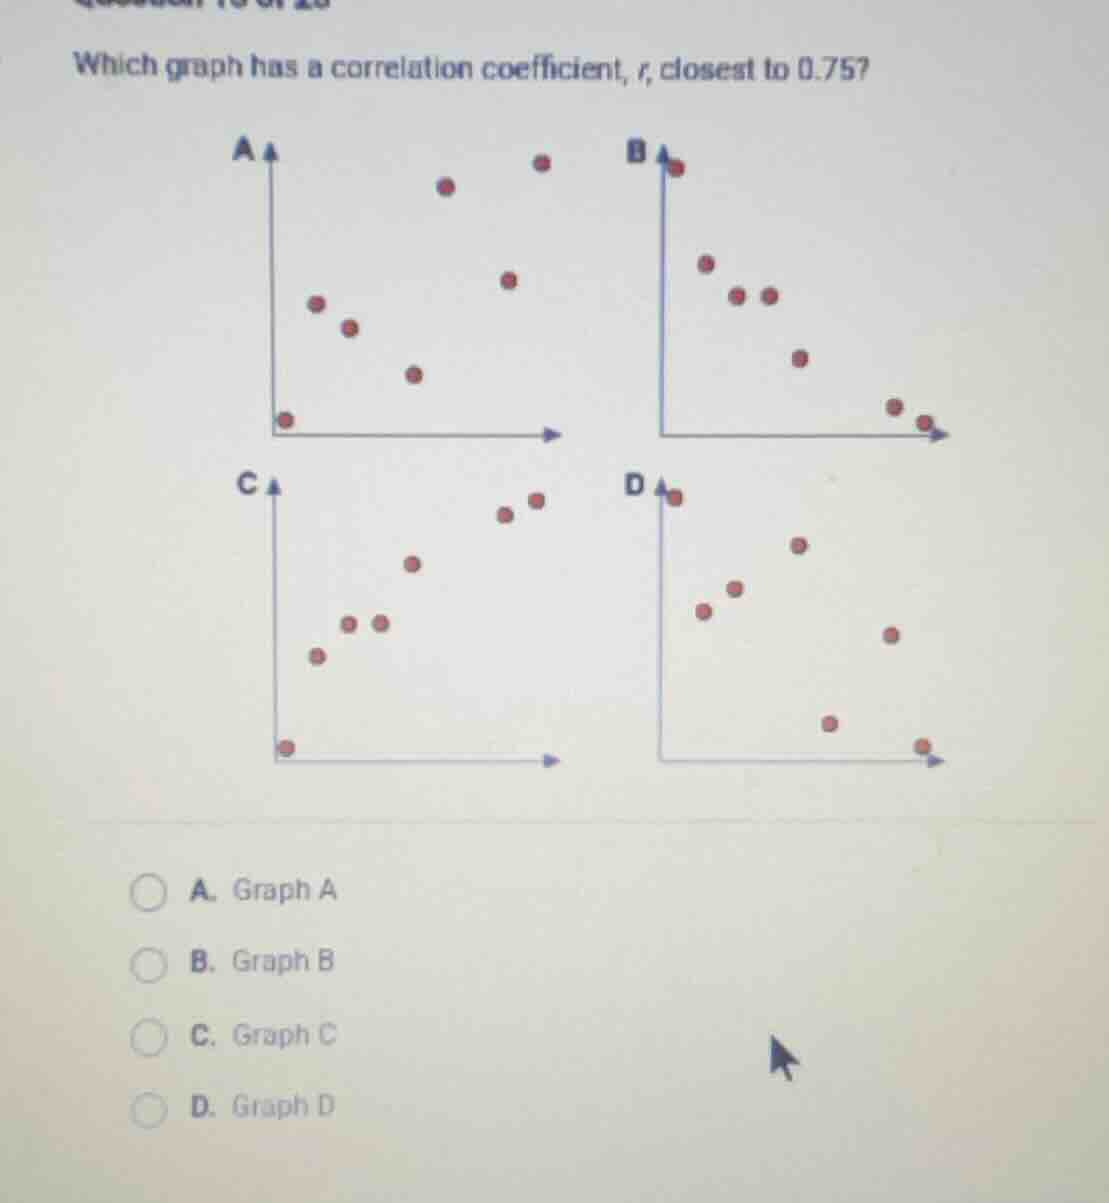
which graph has a correlation coefficient, $r$, closest to 0.75?
a. graph a
b. graph b
c. graph c
d. graph d
Brief Explanations
The correlation coefficient $r$ ranges from -1 to 1. A value of 0.75 indicates a strong positive linear relationship: as the x-value increases, the y-value tends to increase, and the points cluster closely around a positive-slope line.
- Graph A: Points have a weak positive trend, $r$ is much lower than 0.75.
- Graph B: Shows a negative trend, so $r$ is negative, not 0.75.
- Graph C: Points show a strong positive linear trend, clustering closely around an upward line, matching a value near 0.75.
- Graph D: Points have a weak, scattered positive trend with more deviation, $r$ is lower than 0.75.

Snap & solve any problem in the app
Get step-by-step solutions on Sovi AI
Photo-based solutions with guided steps
Explore more problems and detailed explanations
C. Graph C