QUESTION IMAGE
Question
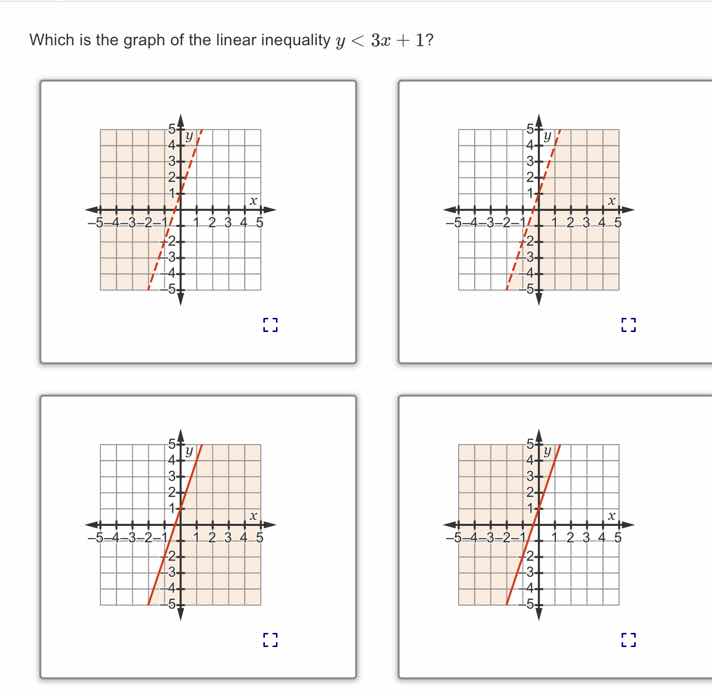
which is the graph of the linear inequality $y < 3x + 1$?
Step1: Analyze the inequality type
The inequality is \( y < 3x + 1 \). For a linear inequality \( y < mx + b \), the boundary line is dashed (since the inequality is strict, \( < \) not \( \leq \)) and we shade the region below the line.
Step2: Identify the boundary line
The equation of the boundary line is \( y = 3x + 1 \). The slope \( m = 3 \) (positive, so the line rises from left to right) and the y - intercept \( b = 1 \) (the line crosses the y - axis at \( (0,1) \)).
Step3: Analyze the shading and line type
- First, check the line type: it should be dashed (because of \( < \), not \( \leq \)). So we can eliminate the options with a solid line (the third and fourth graphs, as they have a solid red line).
- Then, check the shading: we need to shade the region where \( y < 3x + 1 \), i.e., below the line \( y = 3x+1 \).
- For the first graph: The shaded region is above the dashed line? Wait, no, let's re - examine. Wait, the first graph: the line is dashed, and let's take a test point, say \( (0,0) \). Plug into \( y < 3x + 1 \): \( 0<3(0)+1=1 \), which is true. So the region containing \( (0,0) \) should be shaded. Let's see the first graph: the dashed line \( y = 3x + 1 \), when \( x = 0 \), \( y = 1 \). The point \( (0,0) \) is below the line. Now, the second graph: the dashed line, and the shaded region: let's take \( (0,0) \), \( 0<3(0)+1 = 1 \), which is true. Wait, no, maybe I mixed up. Wait, the first graph: the shaded area is on the left - upper? No, wait, let's plot the line \( y=3x + 1 \). When \( x = 0 \), \( y = 1 \); when \( x = 1 \), \( y=4 \); when \( x=- 1 \), \( y=-3 + 1=-2 \). The line goes through \( (0,1) \), \( (1,4) \), \( (-1,-2) \). Now, for the inequality \( y < 3x + 1 \), the solution set is all points below the line. Let's check the two remaining graphs (first and second, since third and fourth have solid lines).
- First graph: The dashed line, and the shaded region: let's take a point in the shaded region, say \( (-2,0) \). Plug into \( y < 3x + 1 \): \( 0<3(-2)+1=-6 + 1=-5 \)? No, that's false. Wait, maybe I got the first and second graphs reversed. Wait, the second graph: let's take \( (0,0) \), \( 0<3(0)+1 = 1 \), true. The second graph's shaded region: when we look at the second graph, the dashed line, and the shaded area is below the line? Wait, maybe the first graph has the shaded area above the line and the second has it below. Wait, let's re - evaluate. The line \( y = 3x+1 \) is increasing (slope 3). For the inequality \( y < 3x + 1 \), the region below the line. Let's take the second graph: the dashed line, and the shaded region is below the line (because when we take \( (0,0) \), it's in the shaded area and satisfies \( y < 3x + 1 \)). The first graph: if we take \( (0,0) \), is it in the shaded area? Wait, maybe the first graph's shaded area is above the line. Let's check the y - intercept. The line crosses the y - axis at \( (0,1) \). In the second graph, the shaded area is below the dashed line (since \( (0,0) \) is in the shaded area and \( 0 < 1 \)). The first graph: the shaded area seems to be above the dashed line (because when \( x = 0 \), the shaded area is above \( y = 1 \)). So the correct graph is the second one (the one in the top - right, with dashed line and shading below the line).

Snap & solve any problem in the app
Get step-by-step solutions on Sovi AI
Photo-based solutions with guided steps
Explore more problems and detailed explanations
The graph in the top - right (the second graph among the four, with a dashed red line and shading below the line \( y = 3x + 1 \))