QUESTION IMAGE
Question
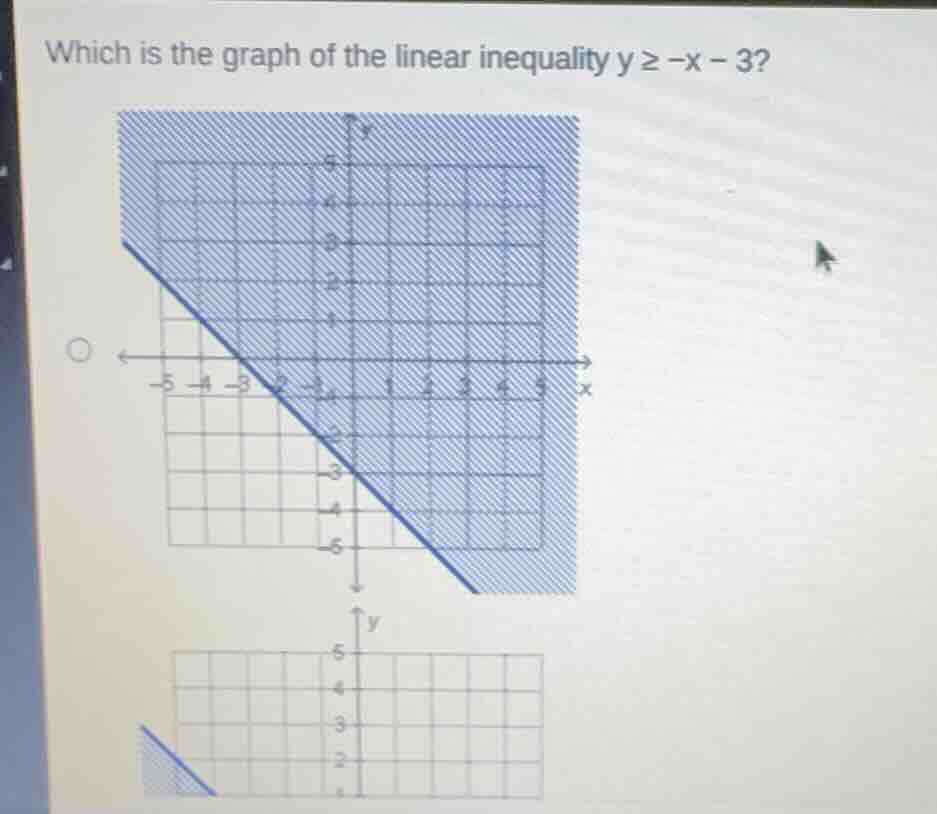
which is the graph of the linear inequality $y \geq -x - 3$? (there is a graph with coordinate axes and shaded regions, and a partial graph below it)
Step1: Analyze the inequality type
The inequality is \( y \geq -x - 3 \). For a linear inequality \( y \geq mx + b \), the boundary line is solid (because of the "greater than or equal to" sign) and we shade above the line. The slope \( m=-1 \) and the y - intercept \( b = - 3 \).
Step2: Check the boundary line and shading
- The equation of the boundary line is \( y=-x - 3 \). When \( x = 0 \), \( y=-3 \), so the line should pass through \( (0,-3) \). When \( y = 0 \), \( 0=-x - 3\Rightarrow x=-3 \), so the line passes through \( (-3,0) \).
- For the inequality \( y\geq -x - 3 \), we test a point above the line, say \( (0,0) \). Substitute into the inequality: \( 0\geq - 0-3\Rightarrow0\geq - 3 \), which is true. So we should shade the region above the line \( y=-x - 3 \). Also, since the inequality is "greater than or equal to", the boundary line should be solid.
Looking at the given graphs (from the description), the first graph (the upper one) has a solid line (since the boundary is part of the solution set for \( \geq \)) and the shading is above the line \( y=-x - 3 \) (passing through \( (0,-3) \) and \( (-3,0) \)) which matches our analysis.

Snap & solve any problem in the app
Get step-by-step solutions on Sovi AI
Photo-based solutions with guided steps
Explore more problems and detailed explanations
The upper graph (with the solid line and shading above \( y = -x - 3 \)) is the graph of \( y\geq -x - 3 \).