QUESTION IMAGE
Question
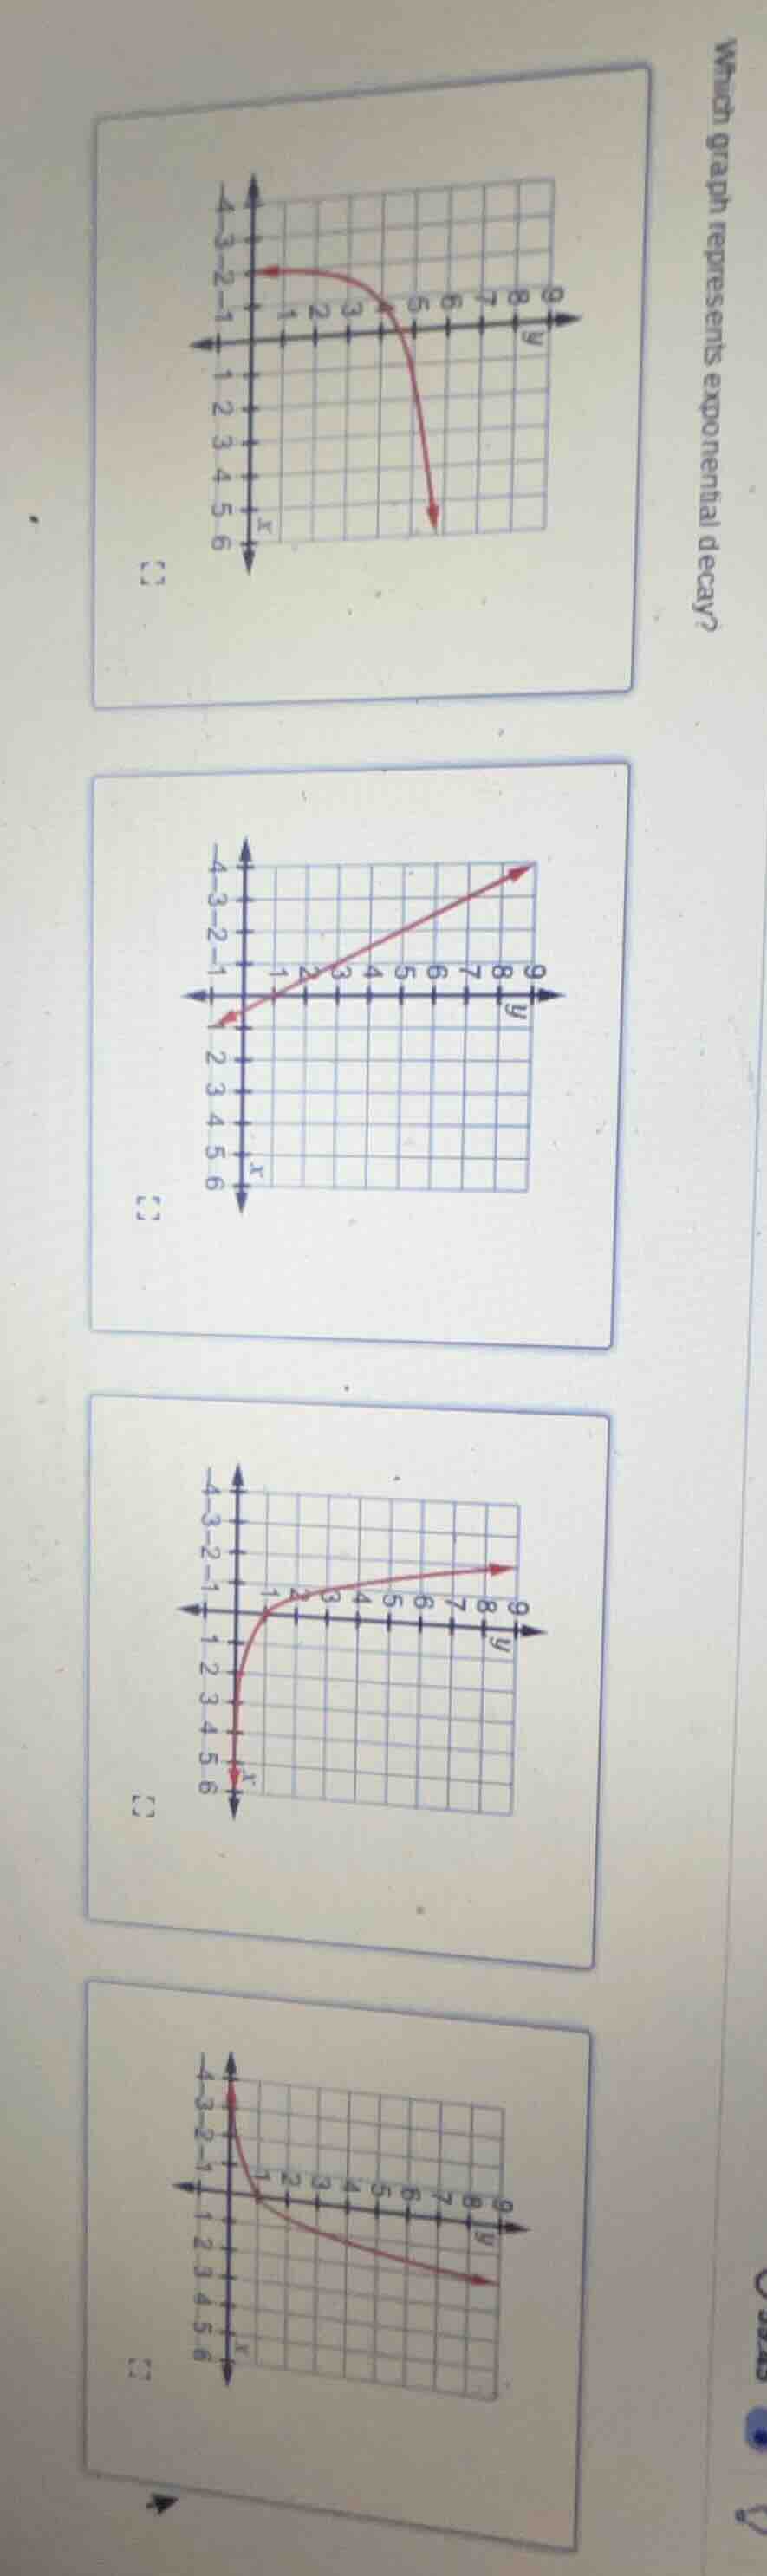
which graph represents exponential decay?
Brief Explanations
Exponential decay graphs are curved, decreasing as \(x\) increases, and approach the x-axis without crossing it. The first graph shows a curve that falls as \(x\) increases, matching this behavior. The second graph is linear (not exponential), the third is exponential growth (increasing), and the fourth decreases but starts at negative \(x\) values, not fitting standard decay for positive domains.

Snap & solve any problem in the app
Get step-by-step solutions on Sovi AI
Photo-based solutions with guided steps
Explore more problems and detailed explanations
[A. The top-most graph with a downward-curving red line that decreases as \(x\) increases]