QUESTION IMAGE
Question
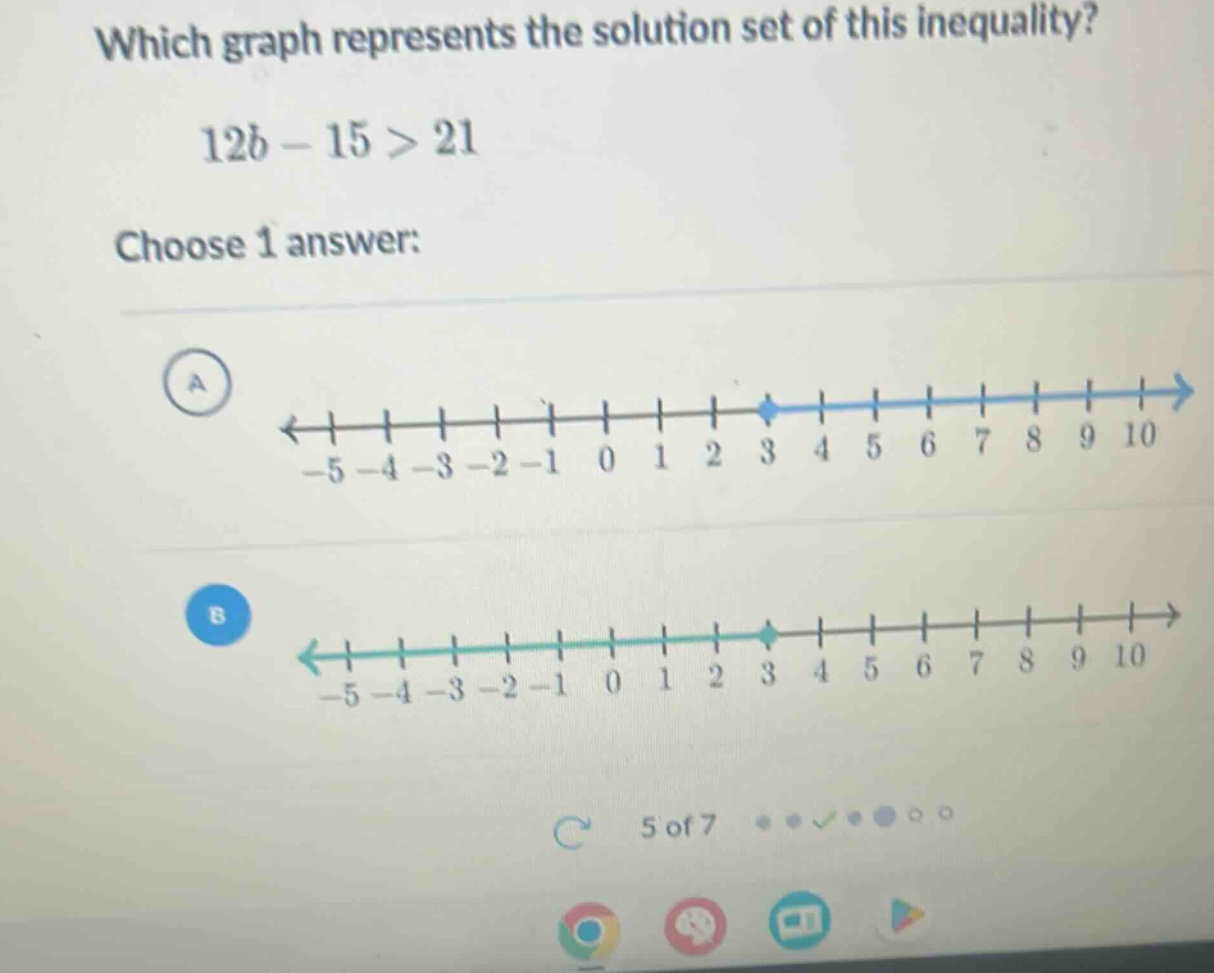
which graph represents the solution set of this inequality?
12b - 15 > 21
choose 1 answer:
Step1: Solve the inequality for \( b \)
Start with the inequality \( 12b - 15 > 21 \). First, add 15 to both sides to isolate the term with \( b \).
\[
12b - 15 + 15 > 21 + 15
\]
Simplifying both sides, we get:
\[
12b > 36
\]
Step2: Divide both sides by 12
Now, divide both sides of the inequality by 12 to solve for \( b \).
\[
\frac{12b}{12} > \frac{36}{12}
\]
Simplifying, we find:
\[
b > 3
\]
Step3: Interpret the solution on the number line
The solution \( b > 3 \) means we need an open circle at 3 (since 3 is not included in the solution) and an arrow pointing to the right (for values greater than 3). Looking at the options, option A has an open circle at 3 and an arrow to the right, while option B has an arrow to the left (which would be for \( b < 3 \)). So the correct graph is option A.

Snap & solve any problem in the app
Get step-by-step solutions on Sovi AI
Photo-based solutions with guided steps
Explore more problems and detailed explanations
A