QUESTION IMAGE
Question
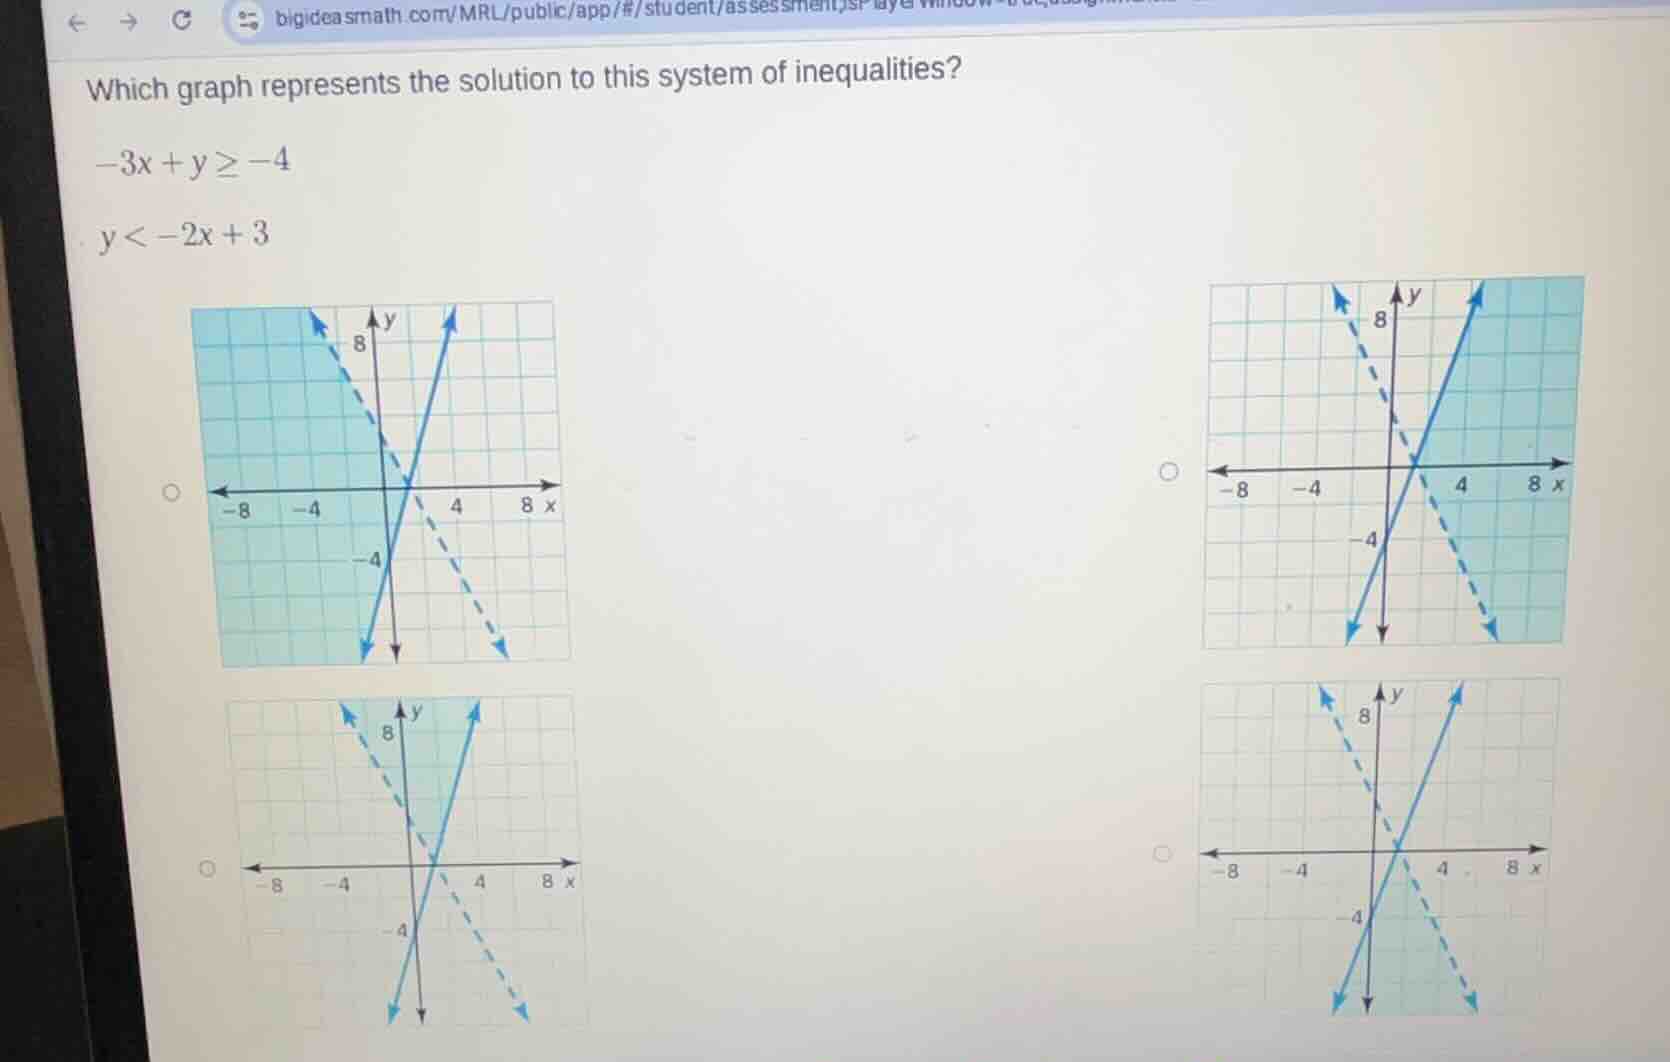
which graph represents the solution to this system of inequalities?
$-3x + y \geq -4$
$y < -2x + 3$
Step1: Analyze the first inequality \(-3x + y \geq -4\)
Rewrite it as \(y \geq 3x - 4\). The boundary line is \(y = 3x - 4\), which has a slope of \(3\) and a \(y\)-intercept of \(-4\). Since the inequality is \(\geq\), the line should be solid, and we shade above the line.
Step2: Analyze the second inequality \(y < -2x + 3\)
The boundary line is \(y = -2x + 3\), with a slope of \(-2\) and a \(y\)-intercept of \(3\). Since the inequality is \(<\), the line should be dashed, and we shade below the line.
Step3: Match with the graphs
- Check the boundary lines: One solid (for \(y \geq 3x - 4\)) and one dashed (for \(y < -2x + 3\)).
- Check the shading: Above the solid line and below the dashed line.
Looking at the options, the first graph (top - left) has a solid line with positive slope (matches \(y = 3x - 4\)) and a dashed line with negative slope (matches \(y=-2x + 3\)), and the shading is above the solid and below the dashed, which fits the system.

Snap & solve any problem in the app
Get step-by-step solutions on Sovi AI
Photo-based solutions with guided steps
Explore more problems and detailed explanations
The top - left graph (the first option among the four graphs)