QUESTION IMAGE
Question
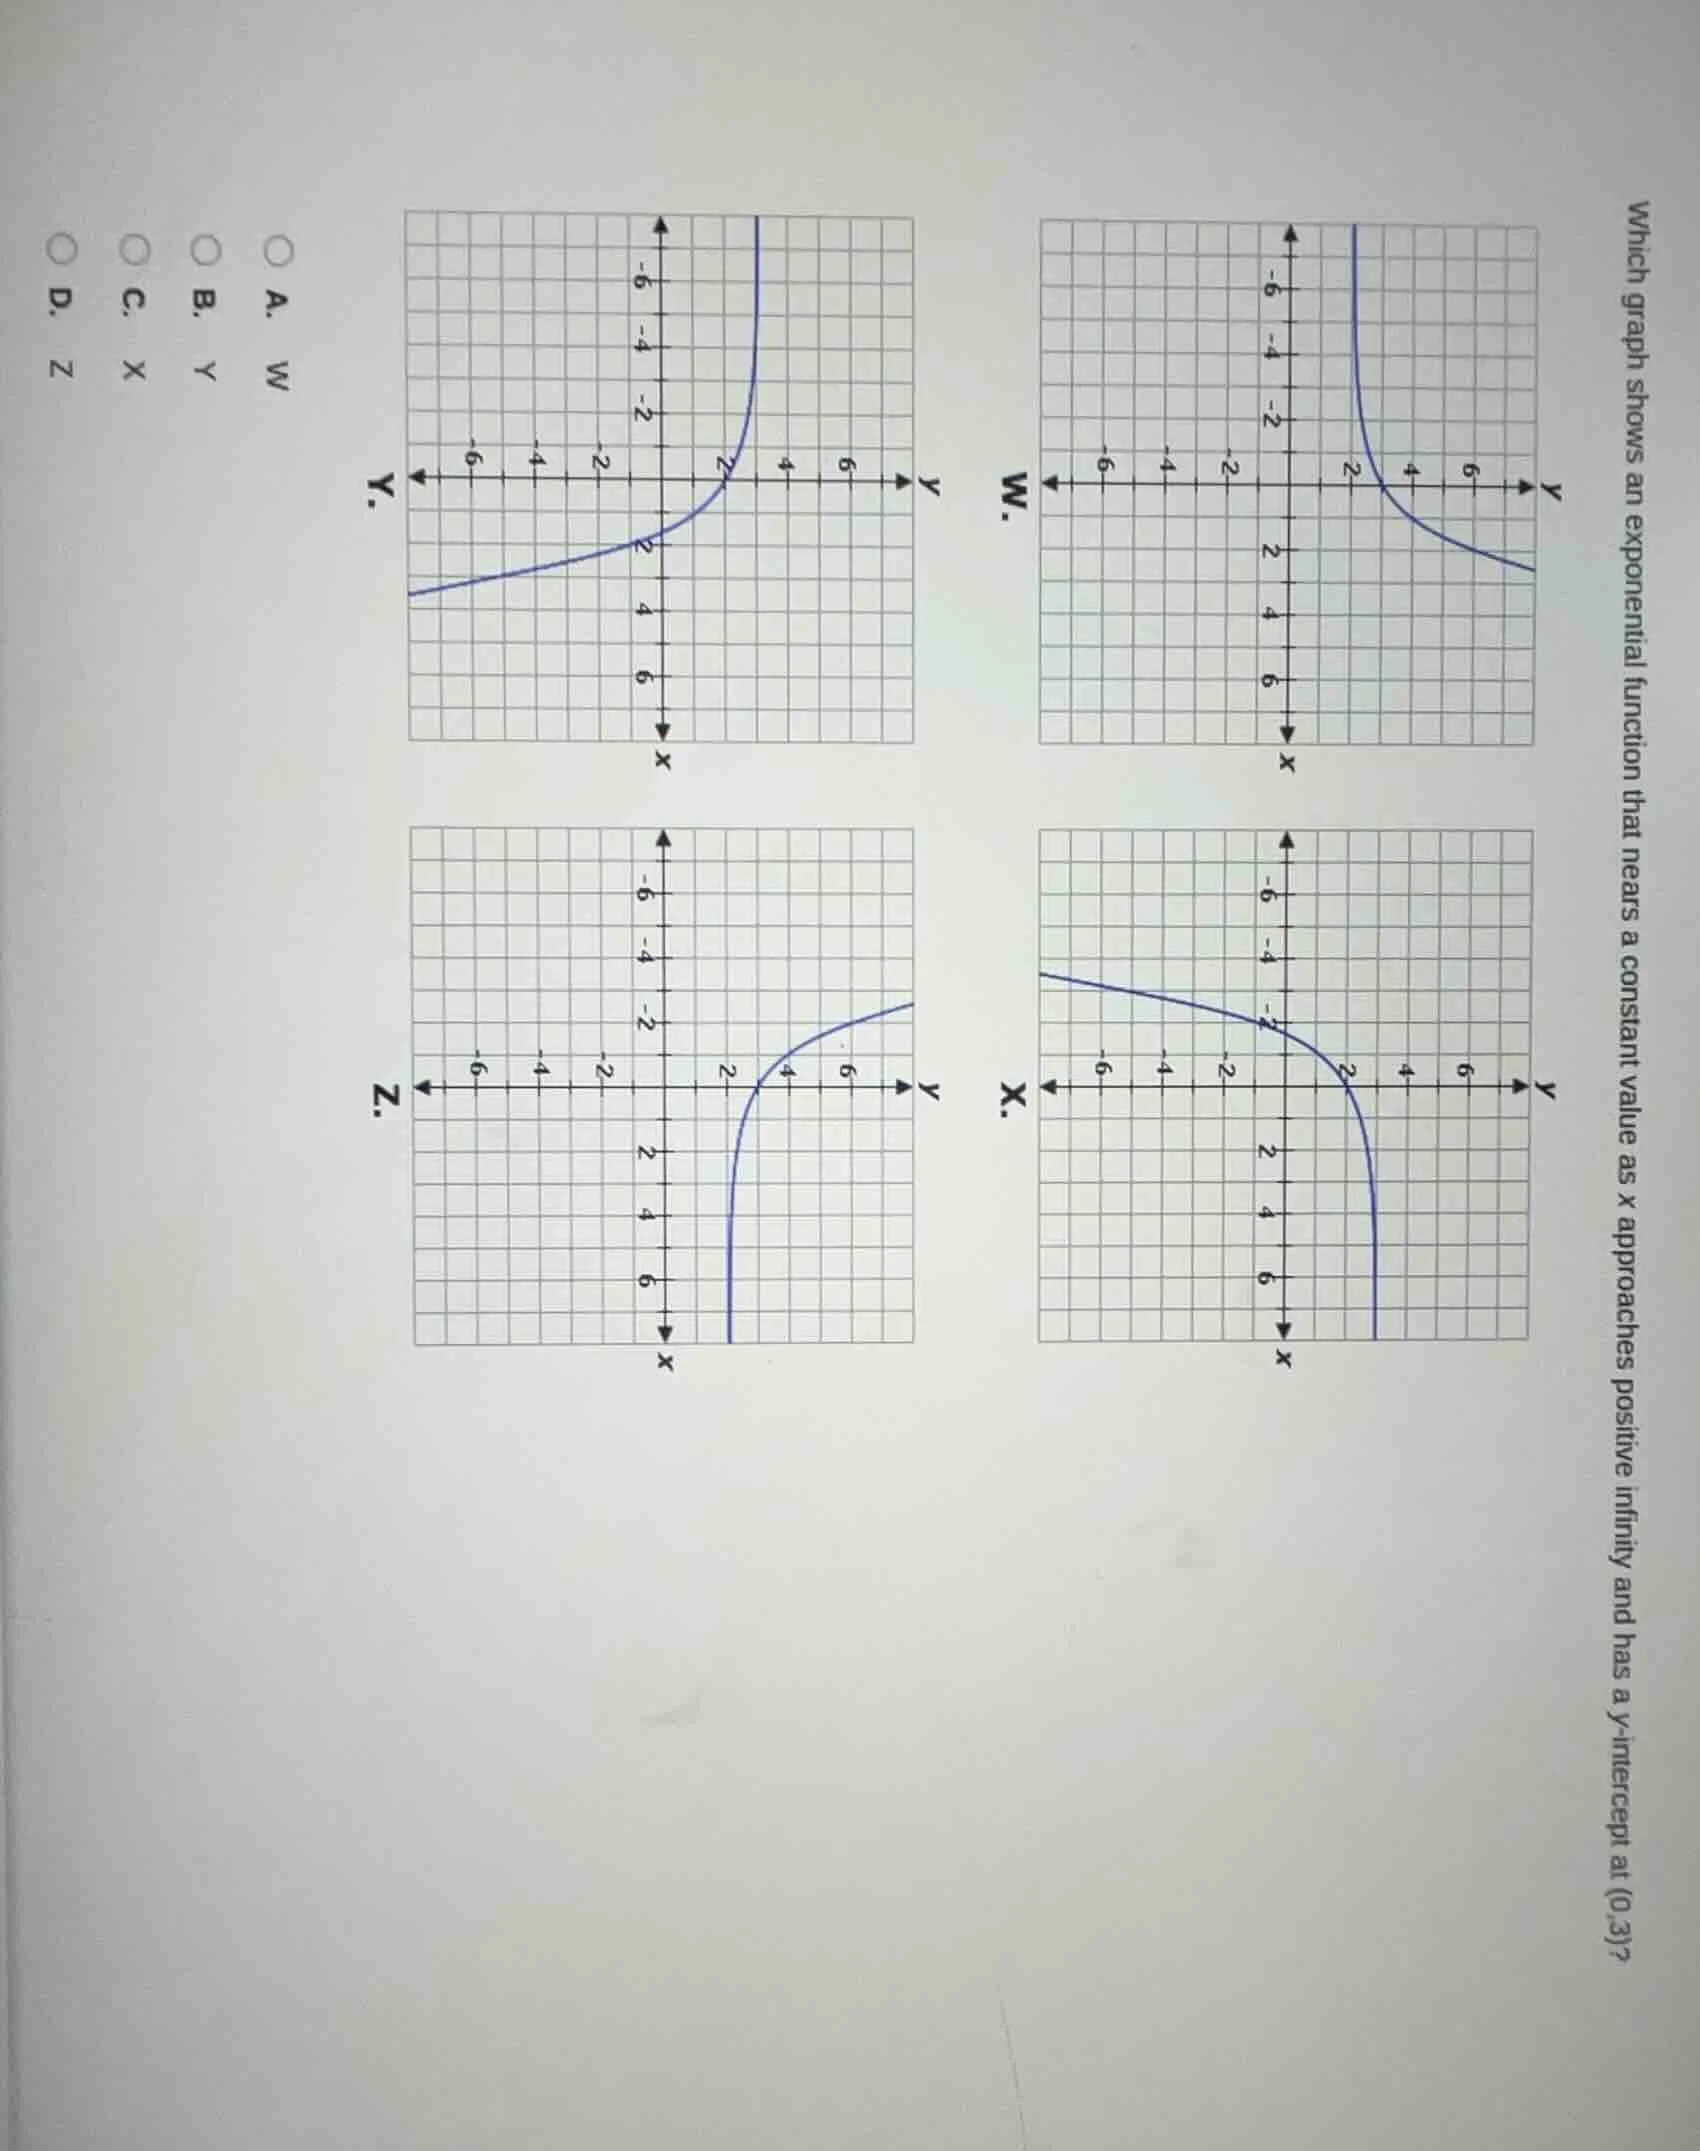
which graph shows an exponential function that nears a constant value as x approaches positive infinity and has a y-intercept at (0,3)?
a. w
b. y
c. x
d. z
Step1: Check y-intercept (0,3)
Verify which graph crosses the y-axis at $y=3$. Graph W has a y-intercept at (0,3); graphs Y, X, Z do not match this.
Step2: Check end behavior as $x\to+\infty$
Confirm the graph approaches a constant value (horizontal asymptote) as $x$ increases. Graph W decreases toward a positive constant as $x\to+\infty$, matching the requirement.

Snap & solve any problem in the app
Get step-by-step solutions on Sovi AI
Photo-based solutions with guided steps
Explore more problems and detailed explanations
A. W