QUESTION IMAGE
Question
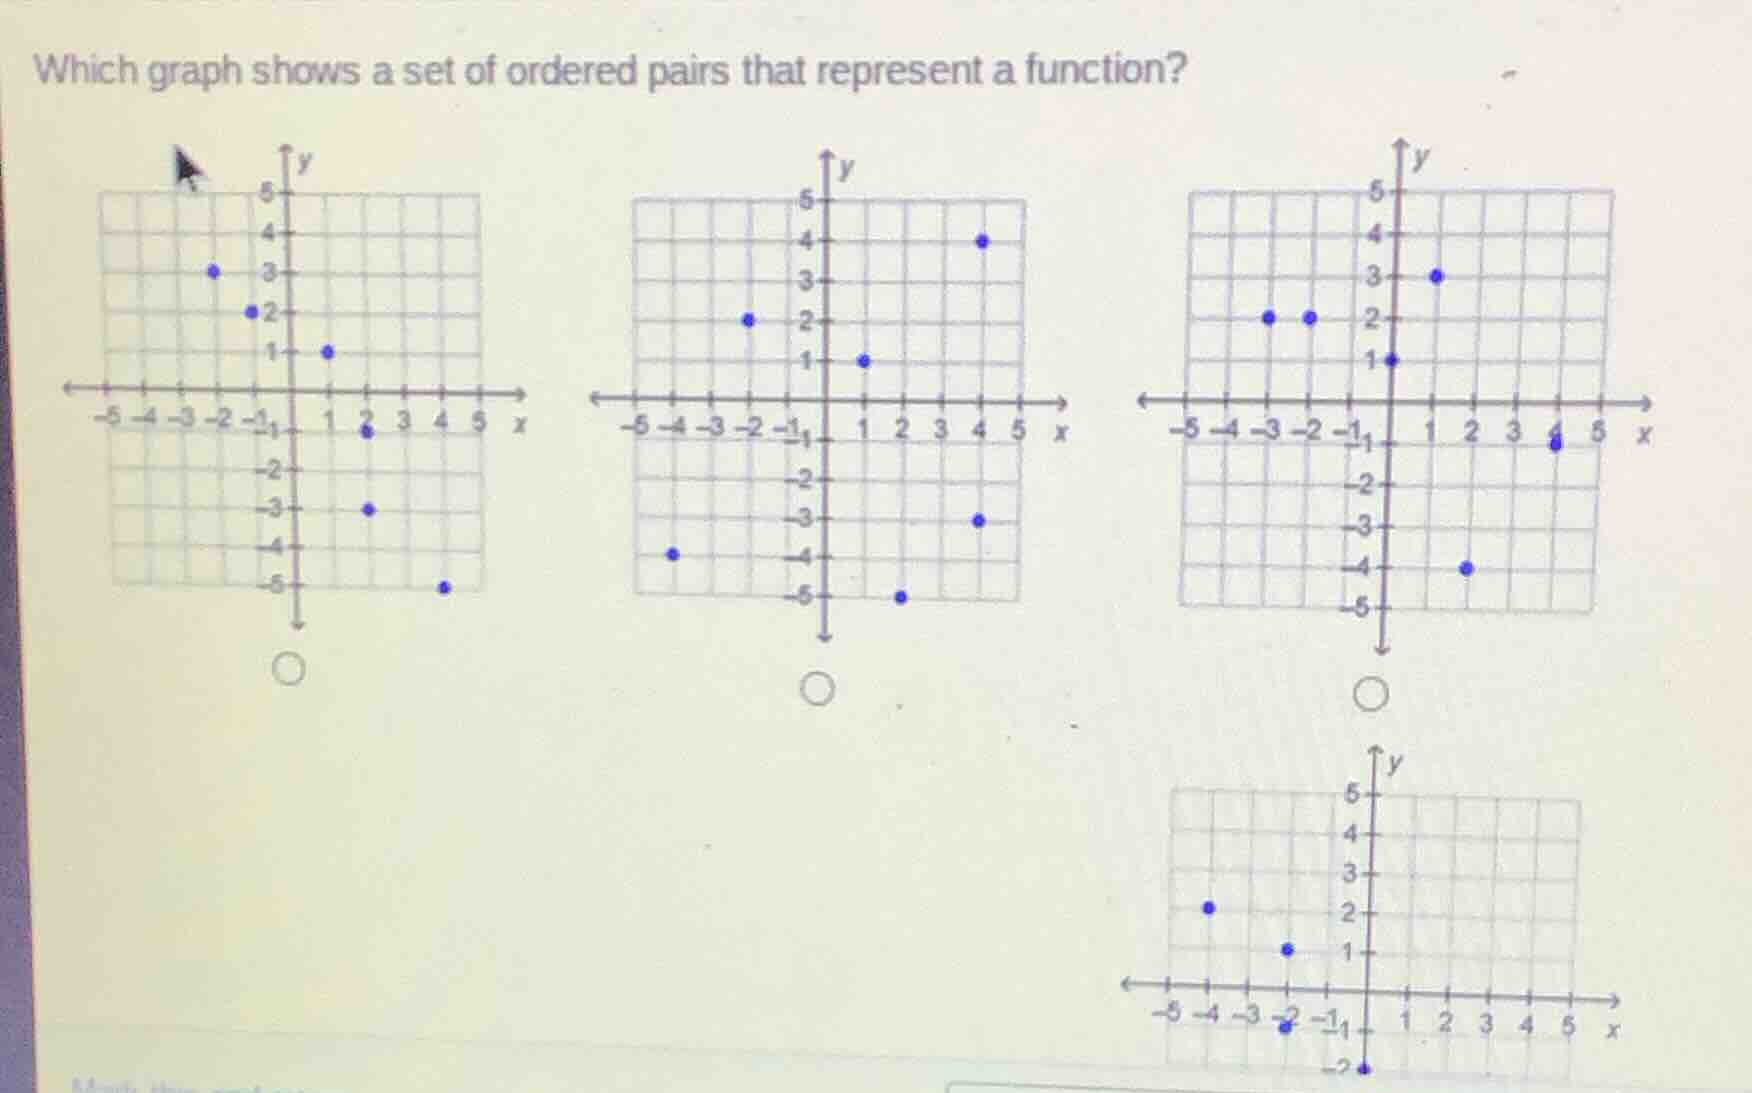
which graph shows a set of ordered pairs that represent a function?
To determine which graph represents a function, we use the vertical line test: a set of ordered pairs is a function if no two points have the same \( x \)-value (i.e., no vertical line intersects the graph more than once).
Step 1: Analyze the first graph
Check the \( x \)-values of each point. Let's list the ordered pairs (estimating coordinates):
- \( (-2, 3) \), \( (-1, 2) \), \( (1, 1) \), \( (2, -1) \), \( (3, -3) \), \( (5, -5) \). Wait, no, actually, looking at the first graph, let's check \( x \)-values. Wait, maybe I misread. Wait, the first graph: let's check if any \( x \)-value is repeated. Wait, no, maybe I made a mistake. Wait, let's check the second graph.
Step 2: Analyze the second graph
List the ordered pairs (estimating coordinates):
- \( (-4, -4) \), \( (-2, 2) \), \( (1, 1) \), \( (2, -5) \), \( (4, 4) \), \( (4, -3) \). Wait, here \( x = 4 \) has two \( y \)-values (\( 4 \) and \( -3 \)), so it fails the vertical line test.
Step 3: Analyze the third graph
List the ordered pairs:
- \( (-3, 2) \), \( (-2, 2) \), \( (0, 1) \), \( (2, 3) \), \( (4, -4) \), \( (2, -4) \)? Wait, no, wait \( x = -3 \) and \( x = -2 \) both have \( y = 2 \)? Wait, no, \( x = -3 \) and \( x = -2 \) are different \( x \)-values. Wait, no, the third graph: points at \( (-3, 2) \), \( (-2, 2) \), \( (0, 1) \), \( (2, 3) \), \( (4, -4) \), \( (2, -4) \)? Wait, no, \( x = 2 \) would have two \( y \)-values? Wait, no, maybe I'm misreading. Wait, the fourth graph? Wait, no, the problem has four graphs? Wait, the user's image shows four graphs? Wait, the original question: "Which graph shows a set of ordered pairs that represent a function?" Let's re-express:
Wait, the key is the vertical line test: each \( x \) has at most one \( y \).
Looking at the second graph (middle top? No, the second graph in the first row? Wait, let's check the fourth graph (bottom right). Wait, no, let's check the first graph:
Wait, first graph (left):
Points: Let's list \( x \)-coordinates:
- \( x = -2 \): one point
- \( x = -1 \): one point
- \( x = 1 \): one point
- \( x = 2 \): one point
- \( x = 3 \): one point
- \( x = 5 \): one point
Wait, no, maybe I'm wrong. Wait, the second graph (middle):
Points:
- \( x = -4 \): one point
- \( x = -2 \): one point
- \( x = 1 \): one point
- \( x = 2 \): one point? No, \( x = 4 \): two points ( \( (4, 4) \) and \( (4, -3) \) ), so that's a repeat of \( x = 4 \), so not a function.
Third graph (right top):
Points:
- \( x = -3 \): one point
- \( x = -2 \): one point
- \( x = 0 \): one point
- \( x = 2 \): one point
- \( x = 4 \): one point
- \( x = 2 \): another point? Wait, no, \( x = 2 \) has two points? No, maybe I'm misreading. Wait, the fourth graph (bottom right):
Points:
- \( x = -4 \): one point
- \( x = -2 \): one point
- \( x = 0 \): one point (at \( y = -2 \))
Wait, no, let's check the first graph again. Wait, maybe the correct graph is the second one? No, wait, the second graph has \( x = 4 \) with two \( y \)-values. The third graph: \( x = -3 \) and \( x = -2 \) both have \( y = 2 \), but those are different \( x \)-values, so that's okay. Wait, no, \( x = -3 \) and \( x = -2 \) are different, so same \( y \) is okay. Wait, the key is same \( x \) with different \( y \) is bad.
Wait, let's check the fourth graph (bottom right):
Points:
- \( (-4, 2) \), \( (-2, 1) \), \( (-2, -2) \), \( (0, -2) \). Wait, \( x = -2 \) has two \( y \)-values ( \( 1 \) and \( -2 \) ), so that's bad.
Wait, the first graph (left):
Points:
- \( (-2, 3) \), \( (-1, 2) \), \( (1, 1) \), \( (2, -1) \), \( (3, -…

Snap & solve any problem in the app
Get step-by-step solutions on Sovi AI
Photo-based solutions with guided steps
Explore more problems and detailed explanations
The first graph (left - most) shows a set of ordered pairs that represent a function.