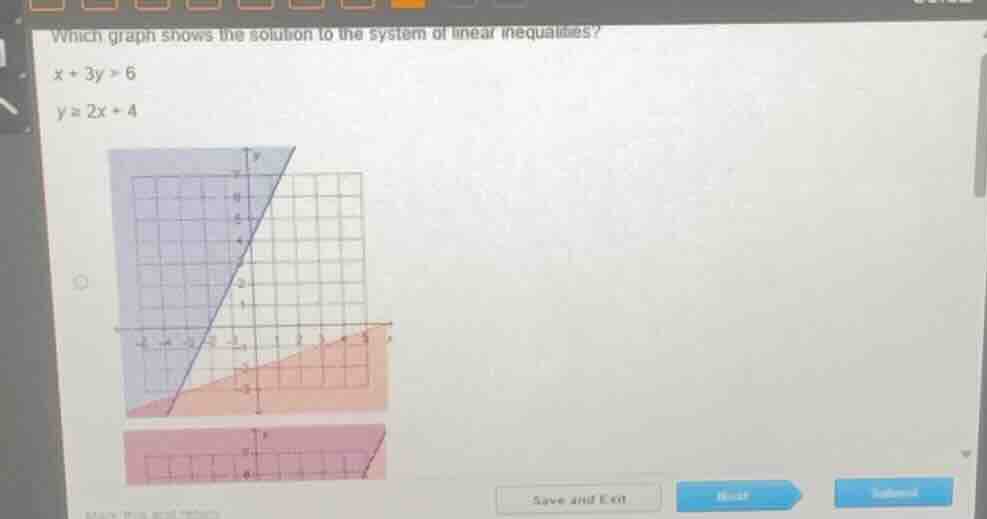
QUESTION IMAGE
Question
which graph shows the solution to the system of linear inequalities?
x + 3y > 6
y ≥ 2x + 4
Step1: Rewrite first inequality to slope-intercept
Rearrange $x + 3y > 6$ to solve for $y$:
$3y > -x + 6$
$y > -\frac{1}{3}x + 2$
This is a dashed line with slope $-\frac{1}{3}$, y-intercept 2, shading above the line.
Step2: Analyze second inequality
$y \geq 2x + 4$ is a solid line with slope 2, y-intercept 4, shading above the line.
Step3: Identify overlapping shaded region
The solution is the area that is shaded above both lines: the dashed line $y = -\frac{1}{3}x + 2$ and the solid line $y = 2x + 4$. This matches the top-most shaded region (the purple/blue area) in the provided image.

Snap & solve any problem in the app
Get step-by-step solutions on Sovi AI
Photo-based solutions with guided steps
Explore more problems and detailed explanations
The correct graph is the top one with the overlapping shaded region above the dashed line $y = -\frac{1}{3}x + 2$ and the solid line $y = 2x + 4$ (the upper shaded area in the image).