QUESTION IMAGE
Question
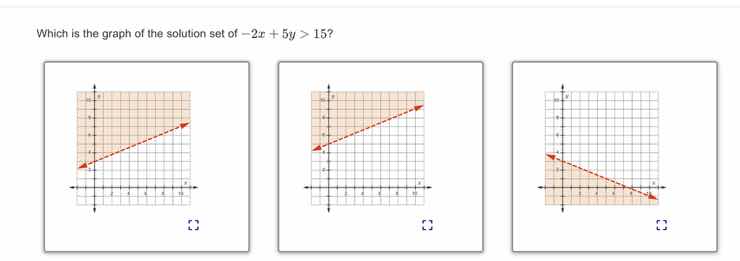
which is the graph of the solution set of (-2x + 5y > 15)?
Step1: Rewrite the inequality in slope - intercept form
We start with the inequality \(-2x + 5y>15\). We want to solve for \(y\) to get it in the form \(y = mx + b\) (slope - intercept form), where \(m\) is the slope and \(b\) is the y - intercept.
First, add \(2x\) to both sides of the inequality:
\(5y>2x + 15\)
Then, divide each term by \(5\):
\(y>\frac{2}{5}x+3\)
Step2: Analyze the boundary line
The inequality is \(y>\frac{2}{5}x + 3\), so the boundary line is \(y=\frac{2}{5}x + 3\). Since the inequality is "greater than" (not "greater than or equal to"), the boundary line should be a dashed line.
The slope of the line \(m=\frac{2}{5}\) (positive slope, so the line goes up from left to right) and the y - intercept \(b = 3\) (the line crosses the y - axis at \((0,3)\)).
Step3: Analyze the region to shade
To determine which side of the line to shade, we can use a test point. A common test point is \((0,0)\) (as long as it is not on the boundary line).
Substitute \(x = 0\) and \(y = 0\) into the inequality \(y>\frac{2}{5}x+3\):
Left - hand side: \(y=0\)
Right - hand side: \(\frac{2}{5}(0)+3=3\)
Since \(0>3\) is false, we do not shade the region that contains the origin \((0,0)\). We shade the region above the line \(y=\frac{2}{5}x + 3\) (because for the inequality \(y>\frac{2}{5}x+3\), we shade the region where the \(y\) - values are greater than the values on the line).
Now, let's analyze the three graphs:
- The first graph: Check the boundary line (dashed or solid? Slope? Y - intercept? Shaded region?). The boundary line should have a slope of \(\frac{2}{5}\), y - intercept of \(3\), be dashed, and the shaded region above the line.
- The second graph: The boundary line has a y - intercept of \(3\), slope \(\frac{2}{5}\) (dashed line), and the shaded region above the line (since \(y>\frac{2}{5}x + 3\) means we shade above the line).
- The third graph: The slope of the line in the third graph is negative (since it goes down from left to right), which does not match the slope \(\frac{2}{5}\) (positive) of our boundary line, so we can eliminate the third graph.
Among the first two, we check the y - intercept and the slope. The line with slope \(\frac{2}{5}\) (positive) and y - intercept \(3\) with a dashed line and shading above the line is the correct one. Assuming the second graph (the middle one) has a dashed line, positive slope, y - intercept at \(3\), and shading above the line, that should be the graph of the solution set.

Snap & solve any problem in the app
Get step-by-step solutions on Sovi AI
Photo-based solutions with guided steps
Explore more problems and detailed explanations
The graph (the middle one among the three) with a dashed line \(y = \frac{2}{5}x+3\) (slope \(\frac{2}{5}\), y - intercept \(3\)) and the region above the line shaded.