QUESTION IMAGE
Question
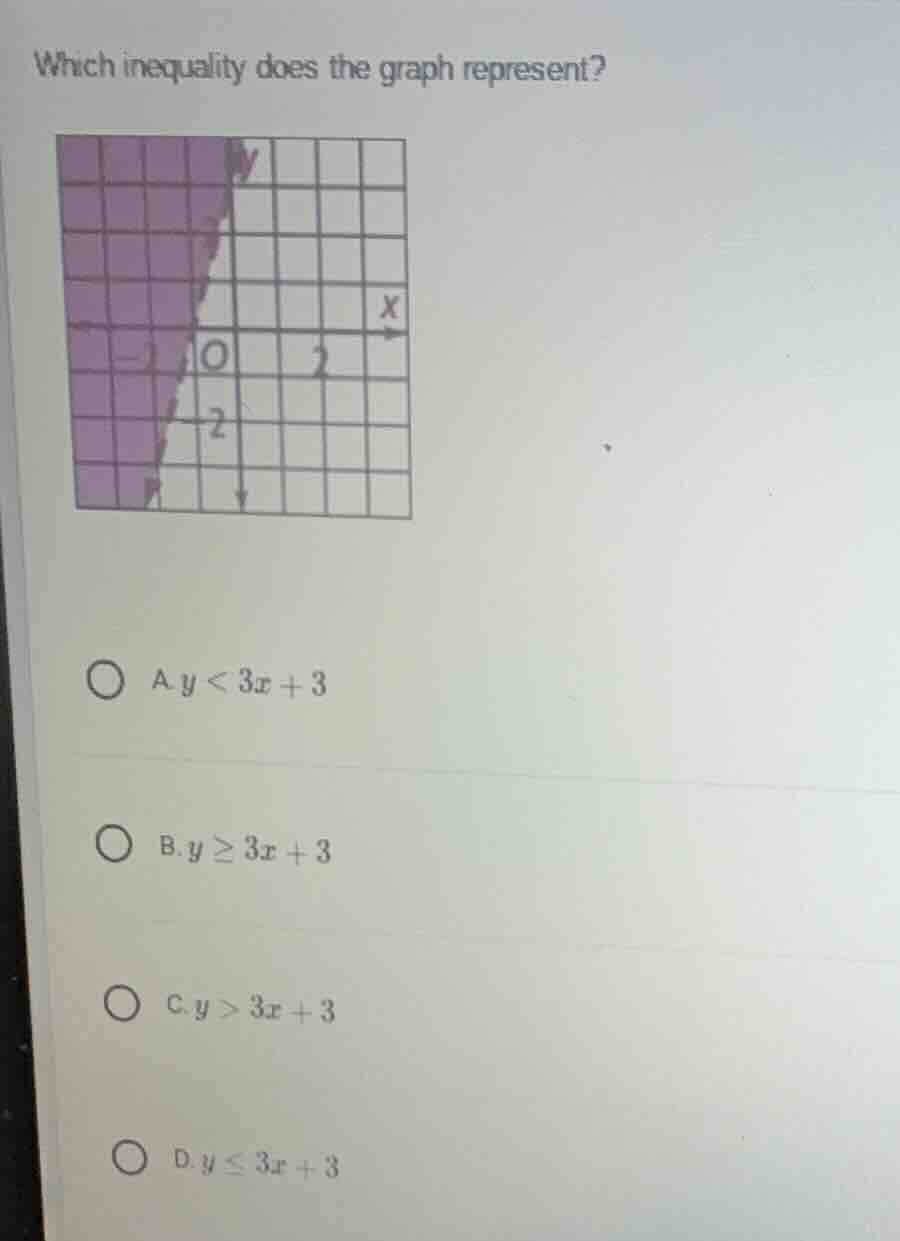
which inequality does the graph represent? a. $y < 3x + 3$ b. $y \geq 3x + 3$ c. $y > 3x + 3$ d. $y \leq 3x + 3$
Step1: Analyze the line's equation and type
The general form of a linear inequality is related to the line \( y = mx + b \), where \( m \) is the slope and \( b \) is the y - intercept. For the line in the graph, the y - intercept \( b = 3 \) (since it crosses the y - axis at \( (0,3) \)) and the slope \( m=\frac{\text{rise}}{\text{run}} \). From the y - intercept \( (0,3) \), if we move 3 units up and 1 unit to the right, we get another point \( (1,6) \), so the slope \( m = 3 \). So the equation of the line is \( y=3x + 3 \). Now, the line in the graph is a dashed line (since the inequality is strict or non - strict? A dashed line means that the points on the line are not included in the solution set, so the inequality sign will be either \( < \) or \( > \), not \( \leq \) or \( \geq \)). So we can eliminate options B (\( y\geq3x + 3 \)) and D (\( y\leq3x + 3 \)) because they have a solid line (since \( \geq \) and \( \leq \) include the line).
Step2: Determine the direction of the inequality
To find which side of the line is shaded, we can test a point. Let's take the origin \( (0,0) \). Plug \( x = 0 \) and \( y = 0 \) into the inequality \( y<3x + 3 \): \( 0<3(0)+3\), which is \( 0 < 3 \), this is true. But wait, the shaded region in the graph is to the left of the line. Wait, maybe I made a mistake in the test point. Let's take a point in the shaded region. Let's take \( x=-1,y = 0 \). Plug into option A: \( 0<3(-1)+3=0 \), \( 0 < 0 \) is false. Plug into option C: \( 0>3(-1)+3=0 \), \( 0>0 \) is false? Wait, no, maybe the line is \( y = 3x+3 \), and the shaded region is where \( y>3x + 3 \) or \( y<3x + 3 \). Wait, the slope is 3, and the line is dashed. Let's re - examine the graph. The shaded area is on the side where for a given x, the y - values are greater than the line? Wait, no, let's look at the line equation again. The line \( y = 3x+3 \), when \( x = - 1 \), \( y=3(-1)+3 = 0 \). The shaded region includes points where, for example, when \( x=-1 \), \( y \) is greater than 0? Wait, no, the graph's shaded region: let's see the line is going from (0,3) with a slope of 3 (up 3, right 1). The dashed line, and the shaded area is on the side where \( y>3x + 3 \)? Wait, no, let's check the options again. Wait, the key is: dashed line means the inequality is strict (\( < \) or \( > \)), and the direction of shading. Let's take a point in the shaded area. Let's take \( (0,4) \). Plug into option C: \( 4>3(0)+3=3 \), \( 4 > 3 \) is true. Plug into option A: \( 4<3(0)+3 = 3 \), \( 4<3 \) is false. Wait, maybe I misread the graph. Wait, the original graph: the shaded area is on the left of the line. Let's check the slope again. Wait, maybe the slope is 3, and the line is \( y = 3x+3 \). The dashed line, and the shaded region is where \( y>3x + 3 \). Wait, but when \( x = 0 \), the line is at \( y = 3 \), and the shaded area is above the line? Wait, no, the options: A is \( y<3x + 3 \), C is \( y>3x + 3 \). Wait, maybe the graph's shaded region is on the side where \( y>3x + 3 \). Wait, let's re - evaluate. The line is dashed, so it's either A or C. Let's take \( x=-1 \), the line is at \( y=3(-1)+3 = 0 \). The shaded region at \( x = - 1 \) has \( y \) values greater than 0? Wait, no, the grid: if the shaded area is on the left, maybe the slope is 3, and the inequality is \( y>3x + 3 \). Wait, but let's check the options again. Wait, maybe I made a mistake in the slope. Wait, the line passes through (0,3) and (-1,0). So the slope \( m=\frac{3 - 0}{0-(-1)}=\frac{3}{1}=3 \), correct. So the line is \( y = 3x+3 \). The dashed…

Snap & solve any problem in the app
Get step-by-step solutions on Sovi AI
Photo-based solutions with guided steps
Explore more problems and detailed explanations
C. \( y > 3x+3 \)