QUESTION IMAGE
Question
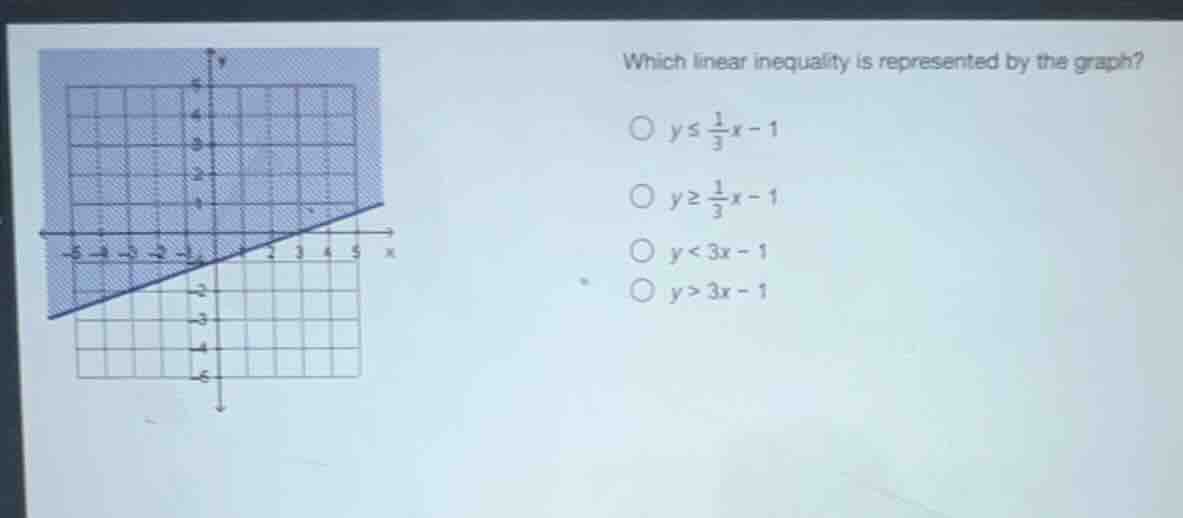
which linear inequality is represented by the graph?
$\bigcirc$ $y \leq \frac{1}{3}x - 1$
$\bigcirc$ $y \geq \frac{1}{3}x - 1$
$\bigcirc$ $y < 3x - 1$
$\bigcirc$ $y > 3x - 1$
Step1: Determine the slope and y-intercept
The line passes through points \((0, -1)\) (y-intercept) and \((3, 0)\). The slope \(m=\frac{0 - (-1)}{3 - 0}=\frac{1}{3}\). So the equation of the line is \(y = \frac{1}{3}x-1\).
Step2: Determine the inequality symbol
The line is solid (so the inequality is \(\leq\) or \(\geq\)) and the shaded region is below the line (so \(y\leq\) the line equation). So the inequality is \(y\leq\frac{1}{3}x - 1\).

Snap & solve any problem in the app
Get step-by-step solutions on Sovi AI
Photo-based solutions with guided steps
Explore more problems and detailed explanations
\(y\leq\frac{1}{3}x - 1\) (corresponding to the first option: \(y\leq\frac{1}{3}x - 1\))