QUESTION IMAGE
Question
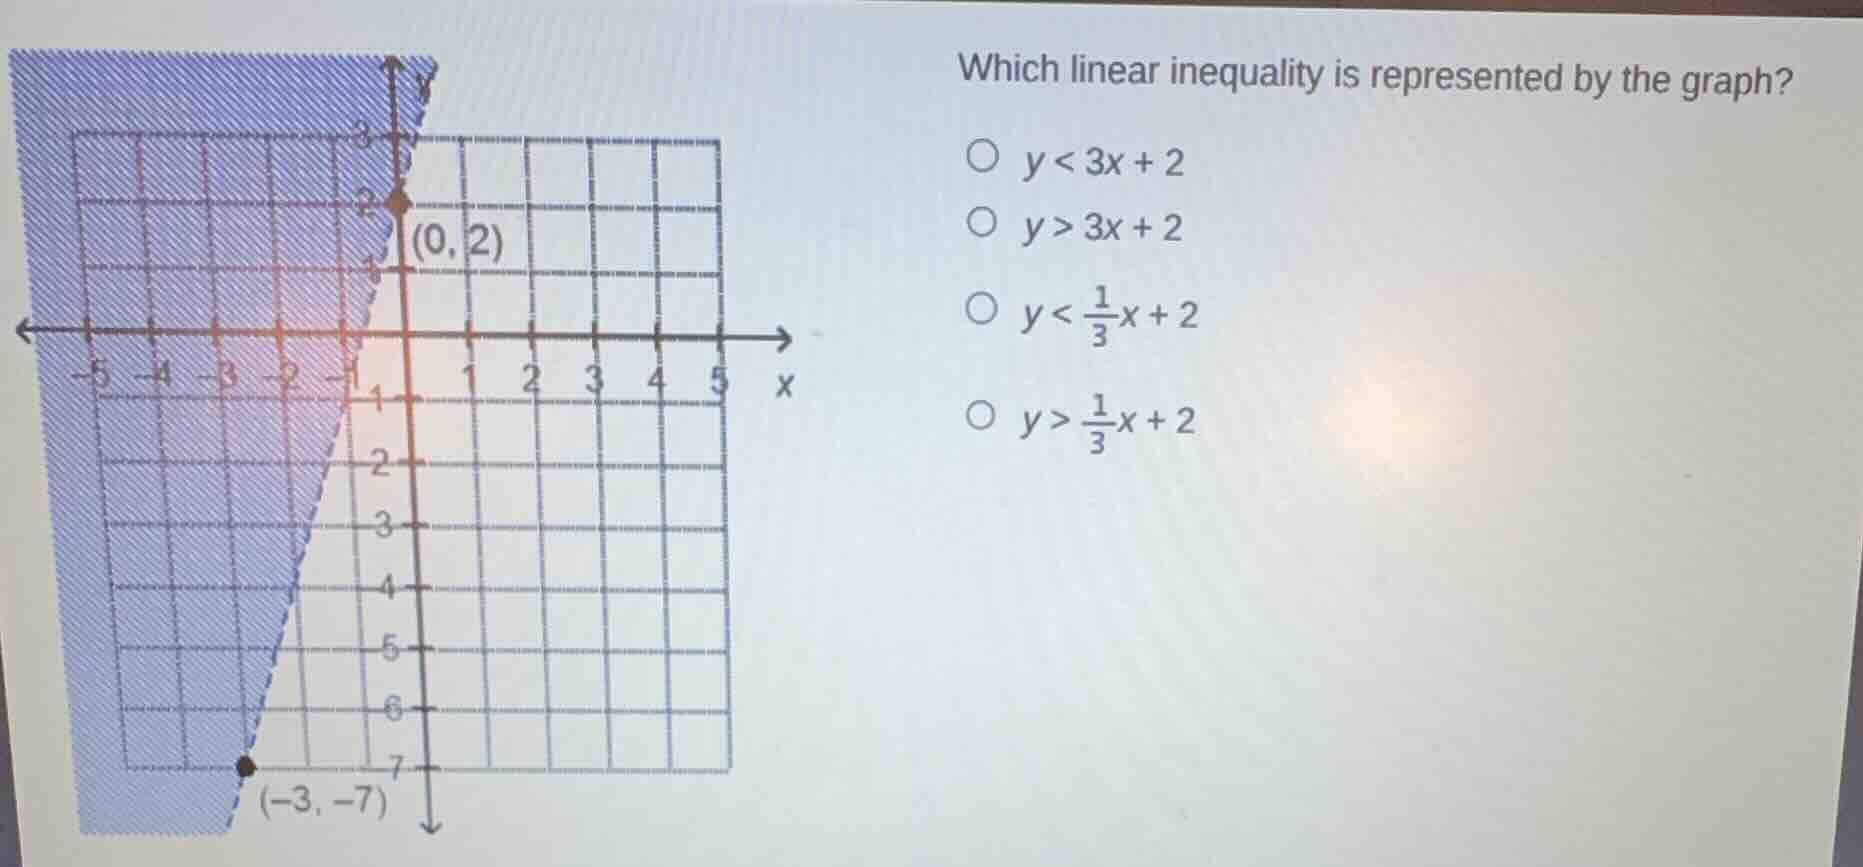
which linear inequality is represented by the graph?
options:
- $y < 3x + 2$
- $y > 3x + 2$
- $y < \frac{1}{3}x + 2$
- $y > \frac{1}{3}x + 2$
graph shows a line passing through (0, 2) and (-3, -7) with shaded region.
Step1: Find the slope of the line
The line passes through \((0, 2)\) and \((-3, -7)\). The slope \(m\) is calculated as \(m=\frac{y_2 - y_1}{x_2 - x_1}=\frac{-7 - 2}{-3 - 0}=\frac{-9}{-3}=3\).
Step2: Determine the equation of the line
Using the slope - intercept form \(y = mx + b\), with \(m = 3\) and \(b = 2\) (since the line crosses the \(y\) - axis at \((0,2)\)), the equation of the line is \(y=3x + 2\).
Step3: Determine the inequality symbol
The line is dashed (so the inequality is strict, either \(>\) or \(<\)) and the shaded region is above the line. For a linear inequality \(y=mx + b\), if the shaded region is above the line, the inequality is \(y>mx + b\). So the inequality is \(y>3x + 2\).

Snap & solve any problem in the app
Get step-by-step solutions on Sovi AI
Photo-based solutions with guided steps
Explore more problems and detailed explanations
\(y>3x + 2\) (the second option: \(y>3x + 2\))