QUESTION IMAGE
Question
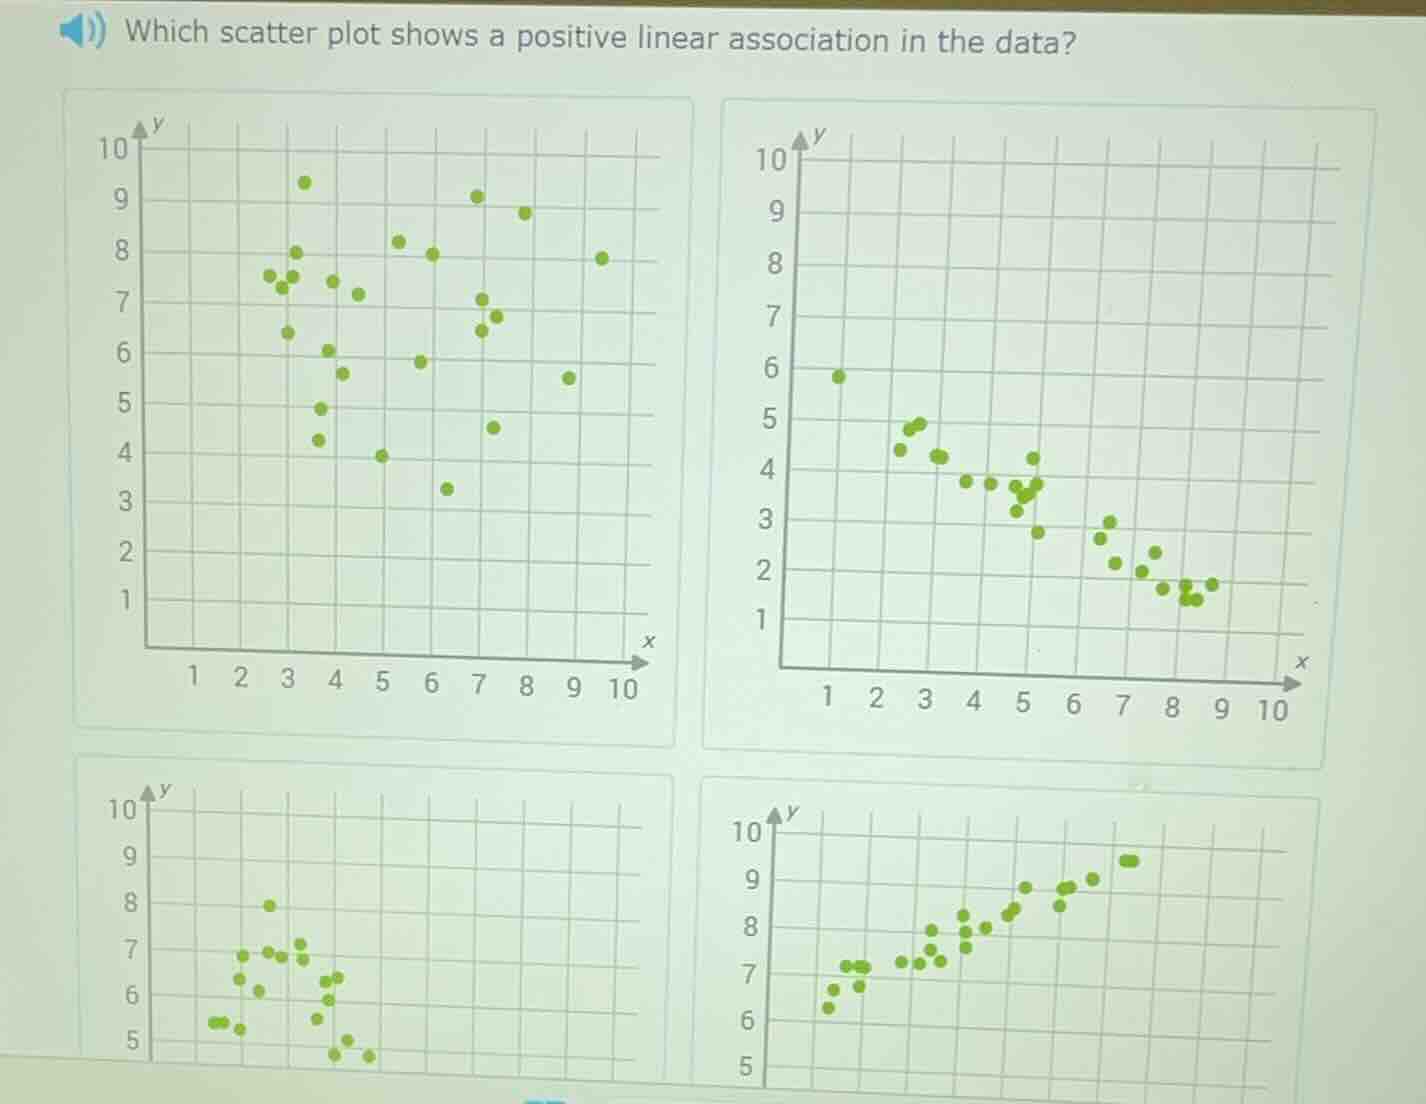
which scatter plot shows a positive linear association in the data?
Brief Explanations
A positive linear association means that as the $x$-value increases, the $y$-value tends to increase in a roughly straight-line pattern.
- Top-left plot: Data has no clear linear trend.
- Top-right plot: As $x$ increases, $y$ decreases (negative association).
- Bottom-left plot: As $x$ increases, $y$ decreases (negative association).
- Bottom-right plot: As $x$ increases, $y$ increases in a roughly linear pattern, matching positive linear association.

Snap & solve any problem in the app
Get step-by-step solutions on Sovi AI
Photo-based solutions with guided steps
Explore more problems and detailed explanations
The bottom-right scatter plot (with points rising from left to right in a linear pattern) shows a positive linear association.