QUESTION IMAGE
Question
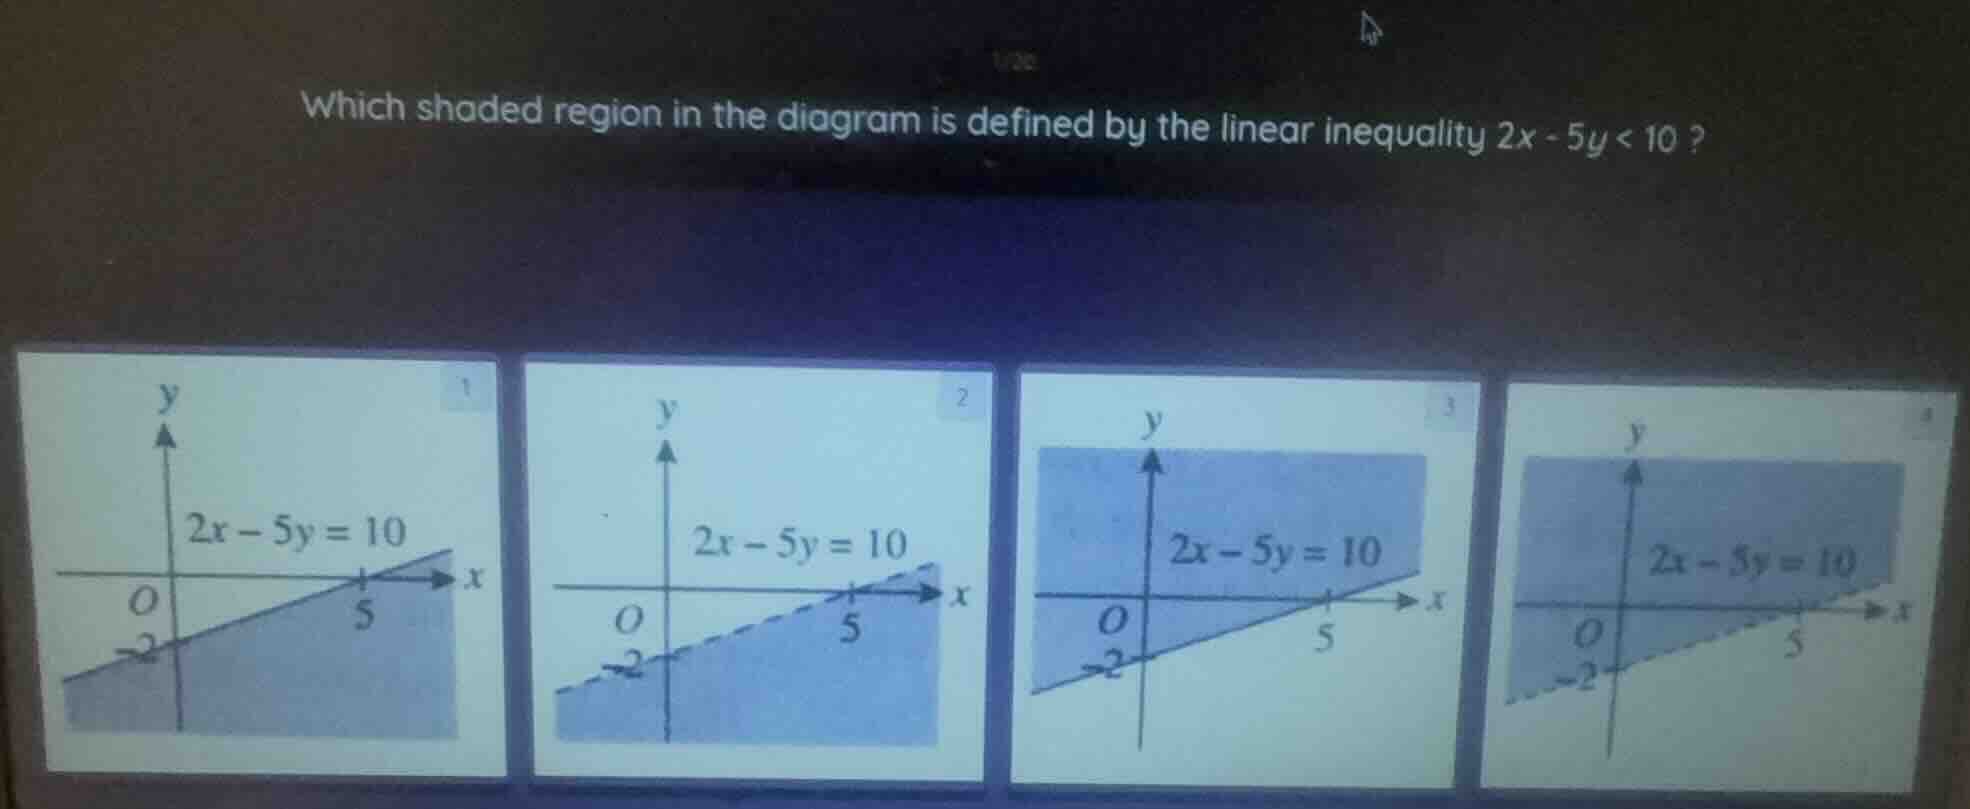
which shaded region in the diagram is defined by the linear inequality $2x - 5y < 10$ ?
Step1: Rewrite the inequality
First, rewrite the inequality \(2x - 5y < 10\) in slope - intercept form (\(y=mx + b\)).
Subtract \(2x\) from both sides: \(-5y<-2x + 10\).
Divide both sides by \(- 5\). Remember that when we divide or multiply an inequality by a negative number, the direction of the inequality sign changes. So we get \(y>\frac{2}{5}x - 2\).
Step2: Analyze the boundary line
The boundary line of the inequality \(2x - 5y=10\) (or \(y = \frac{2}{5}x-2\)):
- Since the inequality is \(2x - 5y<10\) (or \(y>\frac{2}{5}x - 2\)), the boundary line should be a dashed line? Wait, no. Wait, the original inequality is \(2x-5y < 10\), the boundary line \(2x - 5y = 10\) is not included in the solution set (because the inequality is strict, \(<\) not \(\leq\))? Wait, no, let's check the sign again. Wait, when we have \(2x-5y<10\), the boundary line is \(2x - 5y = 10\), and since the inequality is strict (\(<\)), the line should be dashed? Wait, no, let's check with a test point. Let's use the origin \((0,0)\). Plug \(x = 0,y = 0\) into \(2x-5y\): \(2(0)-5(0)=0\). And \(0<10\), which is true. So the region that contains the origin \((0,0)\) is part of the solution.
Wait, let's re - express the inequality correctly. Let's solve \(2x-5y<10\) for \(y\):
\(2x-5y<10\)
\(-5y<-2x + 10\)
Divide both sides by \(-5\) (reverse the inequality sign):
\(y>\frac{2}{5}x-2\)
So the solution region is above the line \(y=\frac{2}{5}x - 2\) (the line \(2x - 5y = 10\)). Also, since the inequality is strict (\(<\) in the original \(2x - 5y<10\), which is equivalent to \(y>\frac{2}{5}x - 2\)), the boundary line should be dashed? Wait, no, the boundary line equation is \(2x - 5y = 10\). Let's check the test point \((0,0)\) in the original inequality: \(2(0)-5(0)=0<10\), which is true. So the region that contains \((0,0)\) is the solution region.
Now, let's analyze the four graphs:
- Graph 1: The boundary line is solid. But our inequality is strict (\(<\)), so the boundary line should be dashed? Wait, no, wait the original inequality is \(2x - 5y<10\), the boundary line \(2x - 5y = 10\) is not included, so the line should be dashed. But let's check the position. The line \(2x-5y = 10\) has \(x\) - intercept when \(y = 0\), \(2x=10\), \(x = 5\); \(y\) - intercept when \(x = 0\), \(-5y=10\), \(y=-2\).
- Graph 2: The boundary line is dashed? Wait, no, looking at the graphs, graph 1 has a solid line, graph 2 has a dashed line? Wait, maybe I made a mistake. Wait, let's re - evaluate.
Wait, the inequality is \(2x-5y<10\). Let's rewrite it as \(2x-5y - 10<0\). The boundary line is \(2x - 5y-10 = 0\) (or \(2x - 5y = 10\)). Since the inequality is strict (\(<\)), the boundary line is not included in the solution set, so it should be a dashed line.
Now, let's find which region contains the origin \((0,0)\). Plug \((0,0)\) into \(2x-5y\): \(2(0)-5(0)=0\), and \(0<10\), so \((0,0)\) is in the solution region.
Now, let's look at the four graphs:
- Graph 1: The shaded region is below the line? Wait, no. Wait the line \(2x - 5y = 10\) goes from \((5,0)\) to \((0, - 2)\). The region above the line (since \(y>\frac{2}{5}x - 2\)): Let's take a point above the line, say \((0,0)\) is above \(y=\frac{2}{5}x - 2\) (when \(x = 0\), \(y=-2\), and \(0>-2\)).
Wait, let's check the four graphs:
Graph 1: Boundary line is solid, shaded region below? No, wait the first graph's shaded region: the line is solid, and the shaded area is below? Wait, no, let's check the \(y\) - intercept. The line \(2x - 5y = 10\) has \(y\) - intercept at \(y=-2\) and \(x\) - intercept at \…

Snap & solve any problem in the app
Get step-by-step solutions on Sovi AI
Photo-based solutions with guided steps
Explore more problems and detailed explanations
The shaded region in graph 4 (the fourth graph with the dashed boundary line \(2x - 5y = 10\) and the shaded region above the line) is defined by the linear inequality \(2x - 5y<10\). (Assuming the fourth graph is labeled as, for example, D. [Graph 4 description], but based on the given graphs, the correct one is the fourth graph with the dashed line and upper - shaded region)