QUESTION IMAGE
Question
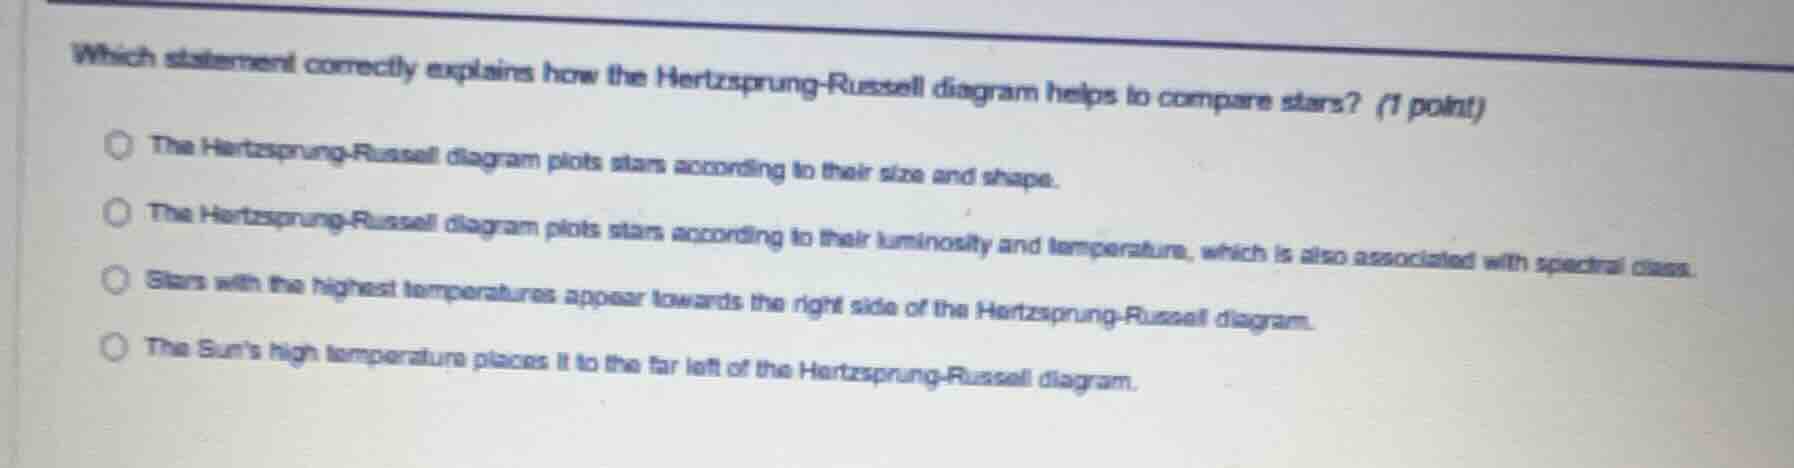
which statement correctly explains how the hertzsprung-russell diagram helps to compare stars? (1 point)
the hertzsprung-russell diagram plots stars according to their size and shape.
the hertzsprung-russell diagram plots stars according to their luminosity and temperature, which is also associated with spectral class.
stars with the highest temperatures appear towards the right side of the hertzsprung-russell diagram.
the sun’s high temperature places it to the far left of the hertzsprung-russell diagram.
The Hertzsprung-Russell (H-R) diagram is a tool that plots stars based on their luminosity (brightness) and surface temperature, where temperature correlates with spectral class.
- The first option is wrong because it does not plot size and shape.
- The third option is incorrect: the H-R diagram has decreasing temperature from left to right, so highest temperature stars are on the left.
- The fourth option is wrong: the Sun has a moderate temperature, so it is not on the far left (which is for hot, blue stars).

Snap & solve any problem in the app
Get step-by-step solutions on Sovi AI
Photo-based solutions with guided steps
Explore more problems and detailed explanations
B. The Hertzsprung-Russell diagram plots stars according to their luminosity and temperature, which is also associated with spectral class.