QUESTION IMAGE
Question
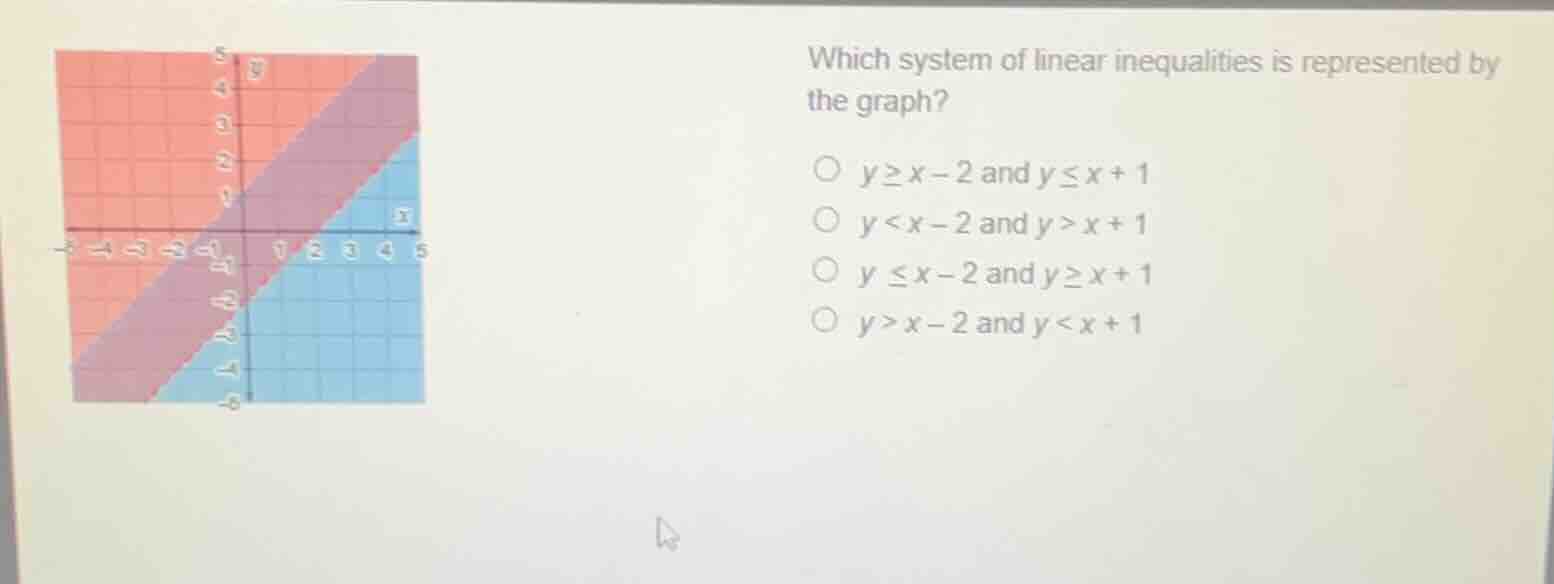
which system of linear inequalities is represented by the graph?
○ $y geq x - 2$ and $y leq x + 1$
○ $y < x - 2$ and $y > x + 1$
○ $y leq x - 2$ and $y geq x + 1$
○ $y > x - 2$ and $y < x + 1$
Step1: Identify line equations
The two lines have slopes of 1. The upper line has a y-intercept of 1, so its equation is $y = x + 1$. The lower line has a y-intercept of -2, so its equation is $y = x - 2$.
Step2: Analyze upper inequality
The shaded region is below the solid line $y = x + 1$, so the inequality is $y \leq x + 1$.
Step3: Analyze lower inequality
The shaded region is above the solid line $y = x - 2$, so the inequality is $y \geq x - 2$.
Step4: Match to options
Combine the two inequalities: $y \geq x - 2$ and $y \leq x + 1$.

Snap & solve any problem in the app
Get step-by-step solutions on Sovi AI
Photo-based solutions with guided steps
Explore more problems and detailed explanations
$y \geq x - 2$ and $y \leq x + 1$