QUESTION IMAGE
Question
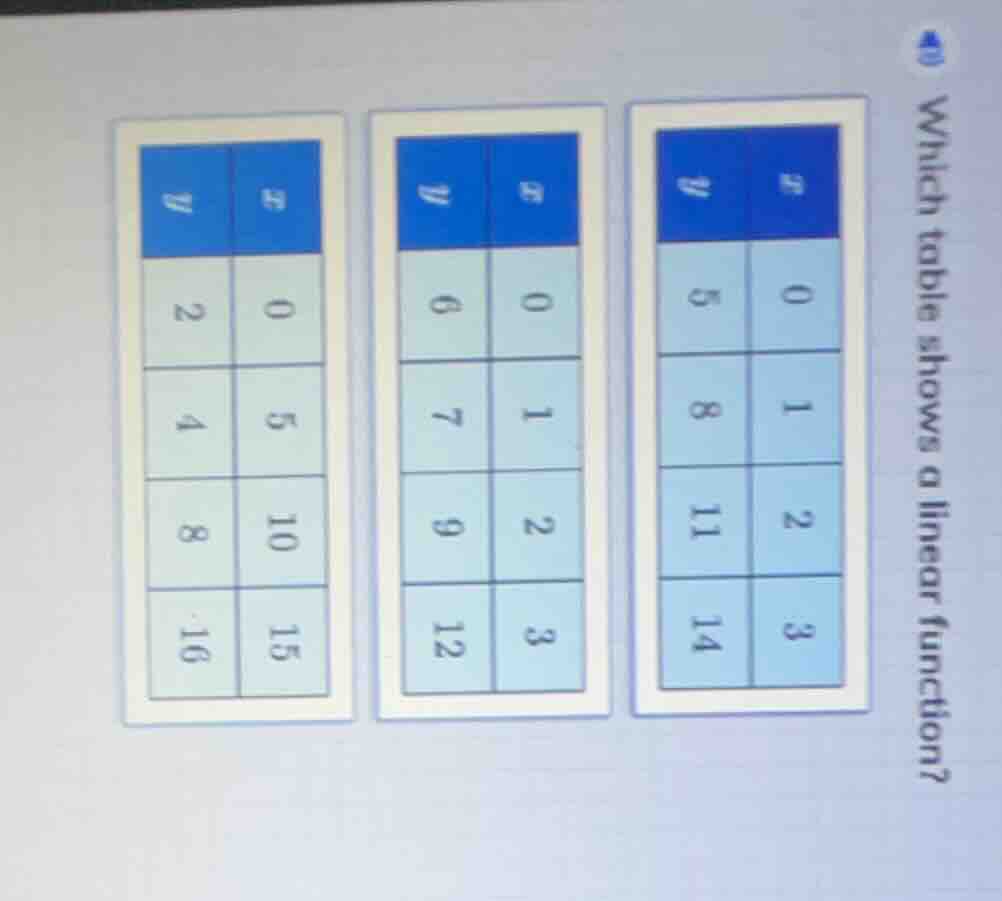
which table shows a linear function?
To determine which table shows a linear function, we check the rate of change (slope) between consecutive points. A linear function has a constant slope. The slope \( m \) between two points \((x_1, y_1)\) and \((x_2, y_2)\) is calculated as \( m=\frac{y_2 - y_1}{x_2 - x_1} \).
Step 1: Analyze the first table
- Points: \((0, 2)\), \((5, 4)\), \((10, 8)\), \((15, 16)\)
- Slope between \((0, 2)\) and \((5, 4)\): \( m_1=\frac{4 - 2}{5 - 0}=\frac{2}{5} = 0.4 \)
- Slope between \((5, 4)\) and \((10, 8)\): \( m_2=\frac{8 - 4}{10 - 5}=\frac{4}{5}=0.8 \)
- Since \( m_1
eq m_2 \), the first table is not linear.
Step 2: Analyze the second table
- Points: \((0, 6)\), \((1, 7)\), \((2, 9)\), \((3, 12)\)
- Slope between \((0, 6)\) and \((1, 7)\): \( m_1=\frac{7 - 6}{1 - 0}=1 \)
- Slope between \((1, 7)\) and \((2, 9)\): \( m_2=\frac{9 - 7}{2 - 1}=2 \)
- Since \( m_1
eq m_2 \), the second table is not linear.
Step 3: Analyze the third table
- Points: \((0, 5)\), \((1, 8)\), \((2, 11)\), \((3, 14)\)
- Slope between \((0, 5)\) and \((1, 8)\): \( m_1=\frac{8 - 5}{1 - 0}=3 \)
- Slope between \((1, 8)\) and \((2, 11)\): \( m_2=\frac{11 - 8}{2 - 1}=3 \)
- Slope between \((2, 11)\) and \((3, 14)\): \( m_3=\frac{14 - 11}{3 - 2}=3 \)
- Since the slope is constant (\( m = 3 \)) for all consecutive points, the third table shows a linear function.

Snap & solve any problem in the app
Get step-by-step solutions on Sovi AI
Photo-based solutions with guided steps
Explore more problems and detailed explanations
The third table (with \( x \) values 0, 1, 2, 3 and \( y \) values 5, 8, 11, 14) shows a linear function.