QUESTION IMAGE
Question
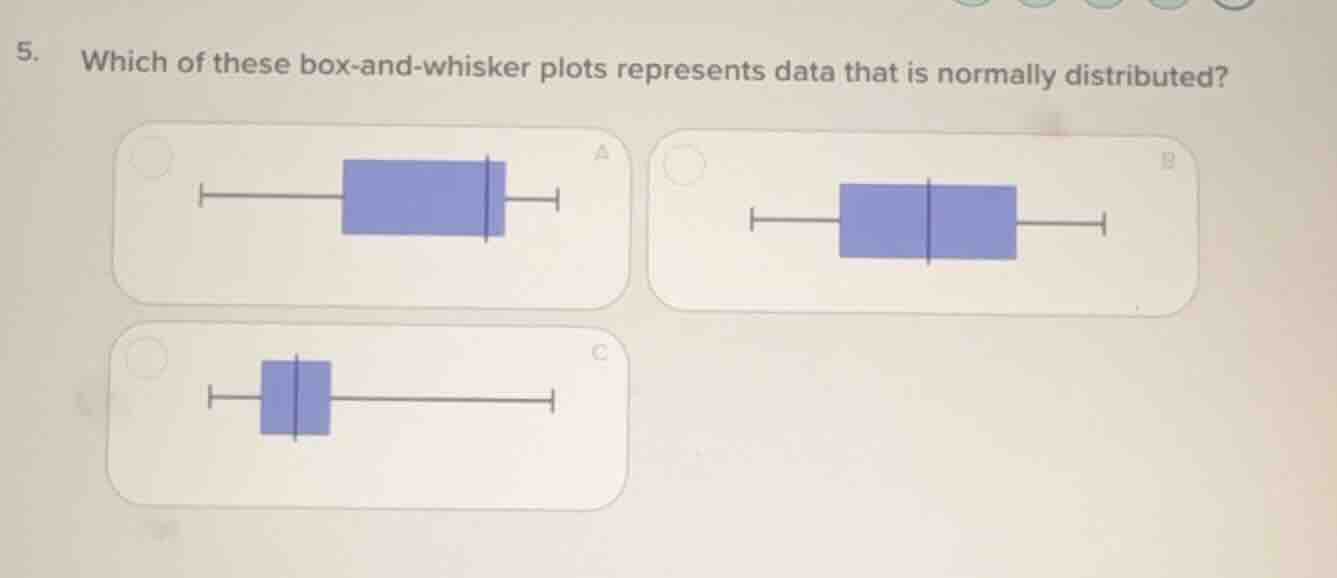
- which of these box - and - whisker plots represents data that is normally distributed? (there are three box - and - whisker plots labeled a, b, c, and each has a selection circle in front of it)
Brief Explanations
For a normally distributed data, the box - and - whisker plot should be symmetric about the median (the line inside the box). In a normal distribution, the left and right parts of the box (representing the lower and upper quartiles) and the whiskers (representing the spread of data outside the quartiles) should be relatively symmetric around the median.
- For plot A: The left whisker is long and the right part is short, so it is not symmetric.
- For plot B: The left and right parts of the box and the whiskers are relatively symmetric around the median line inside the box, which is consistent with the symmetry of a normal distribution.
- For plot C: The left part is short and the right whisker is long, so it is not symmetric.

Snap & solve any problem in the app
Get step-by-step solutions on Sovi AI
Photo-based solutions with guided steps
Explore more problems and detailed explanations
B. The box - and - whisker plot with relatively symmetric box and whiskers around the median (consistent with normal distribution symmetry)