QUESTION IMAGE
Question
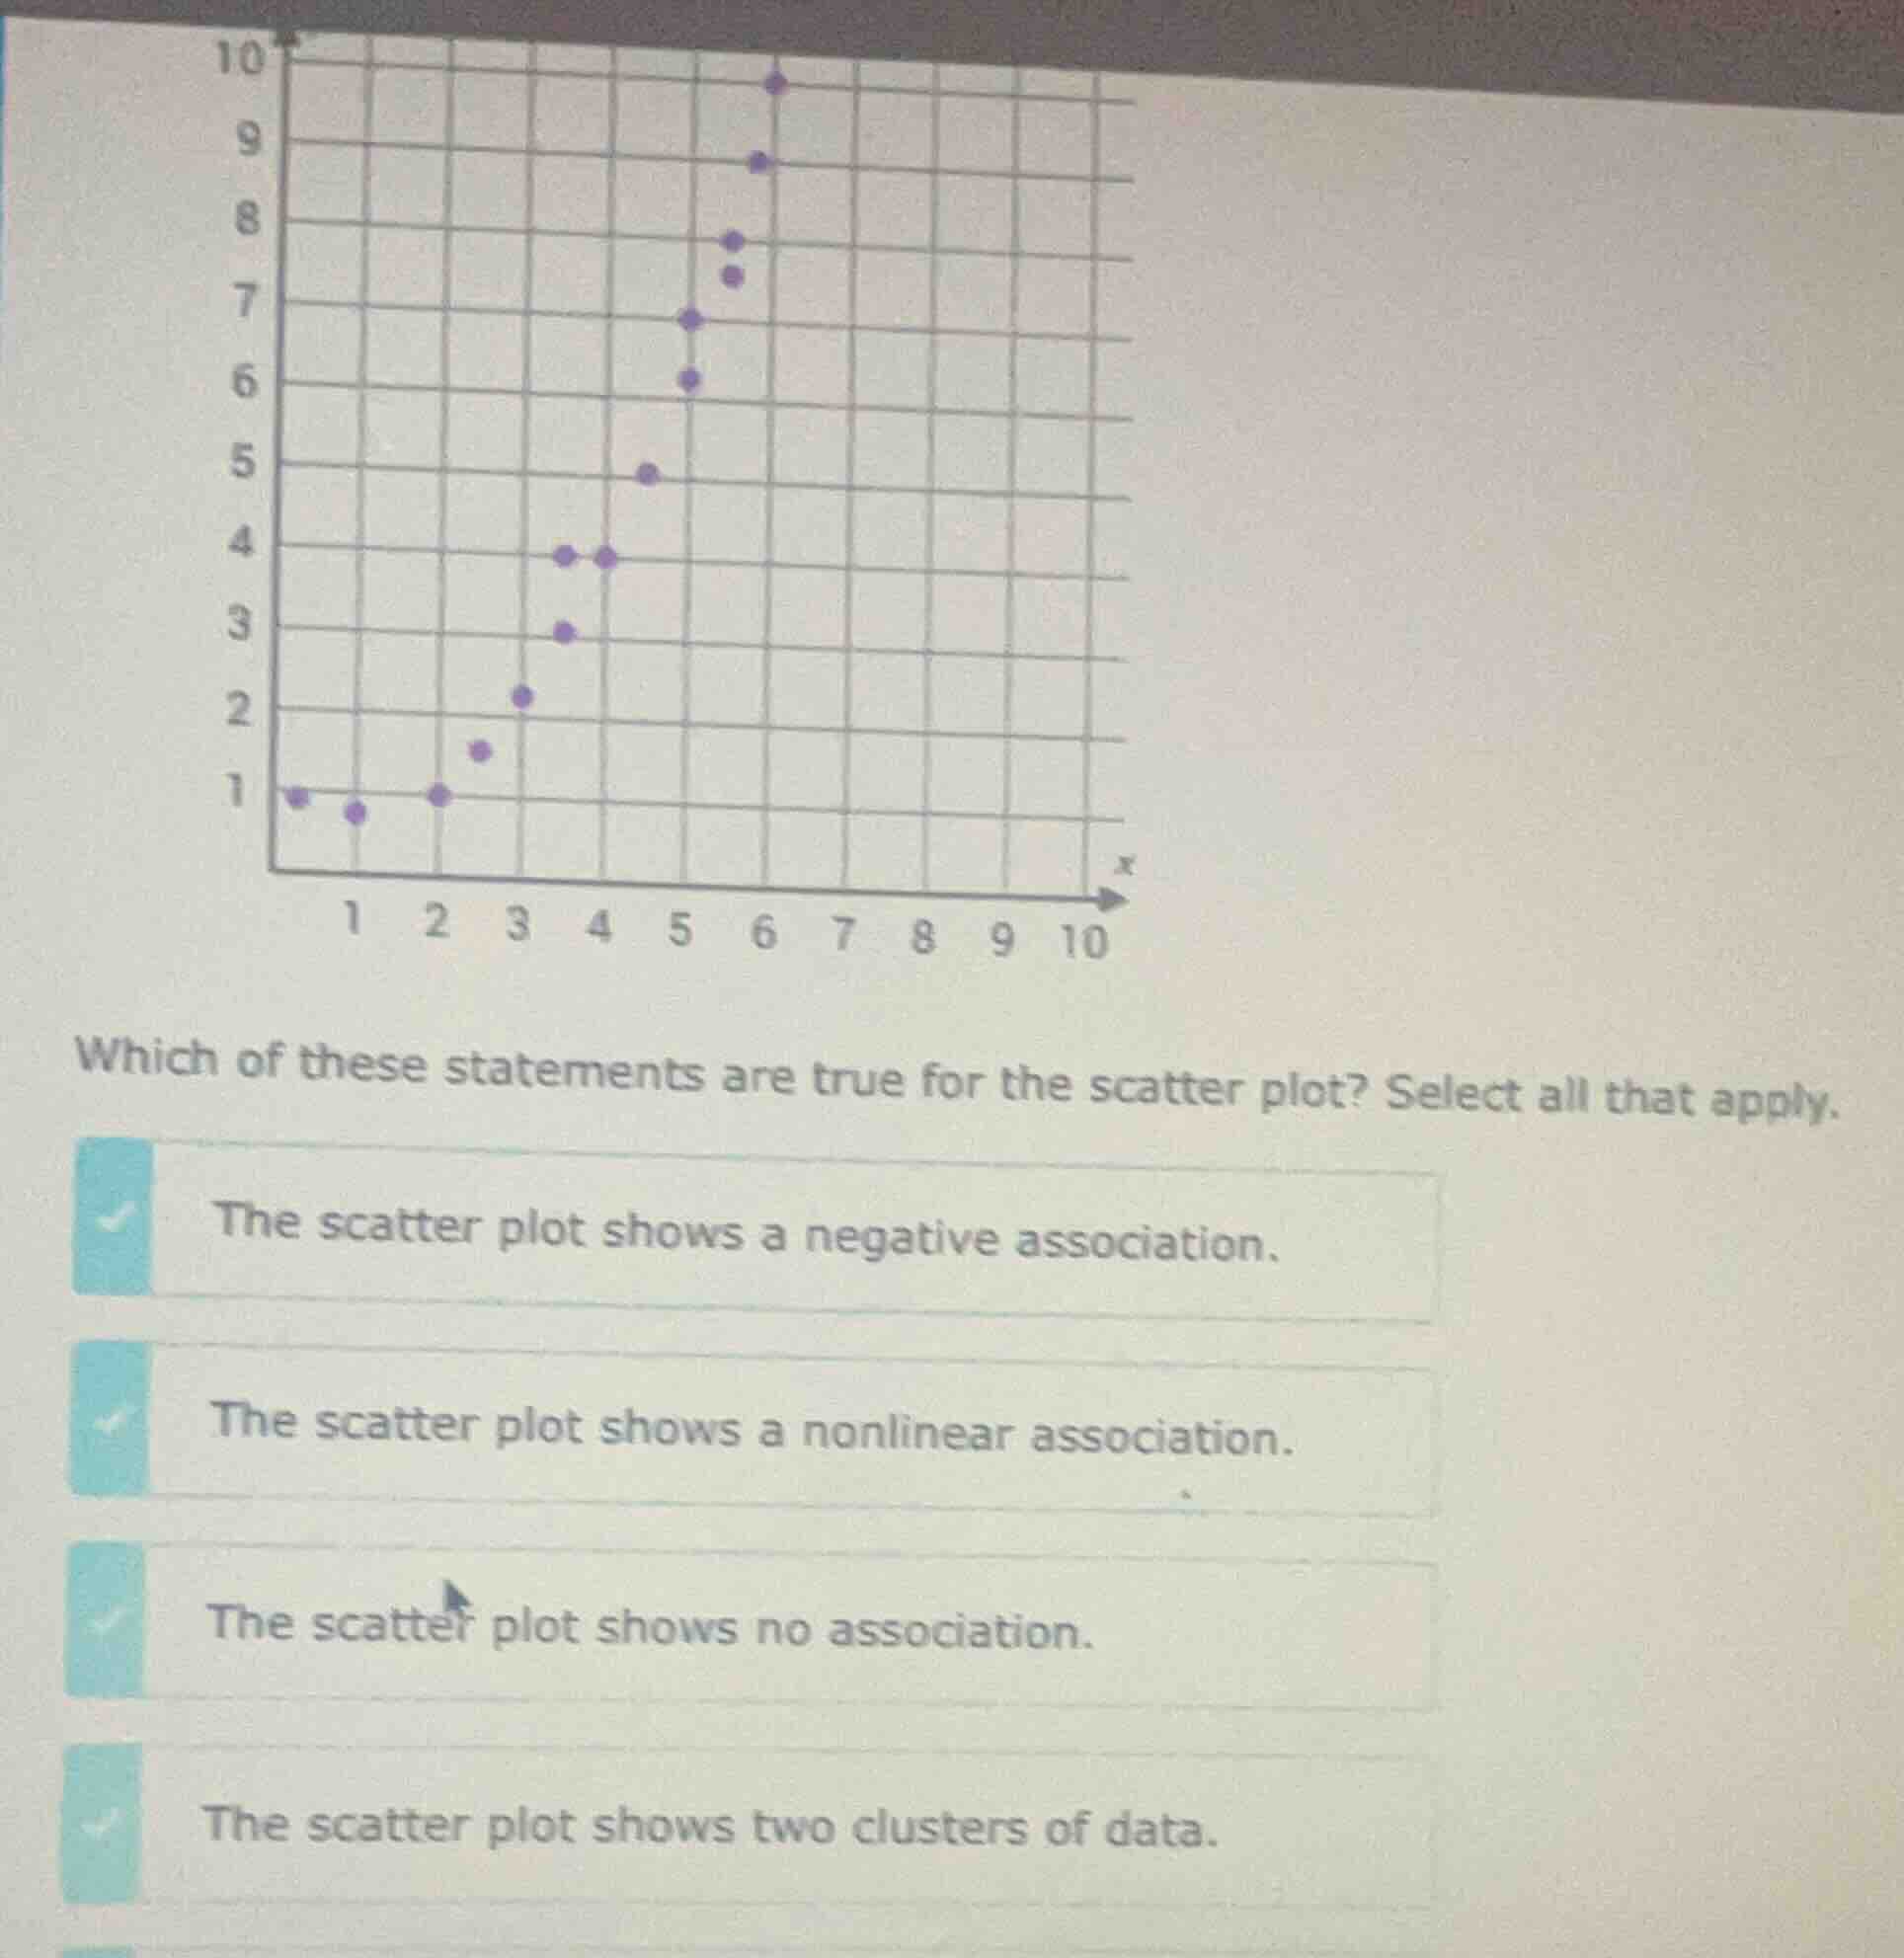
which of these statements are true for the scatter plot? select all that apply. the scatter plot shows a negative association. the scatter plot shows a nonlinear association. the scatter plot shows no association. the scatter plot shows two clusters of data.
Brief Explanations
- A positive association means as x increases, y increases; here, as x goes from 0 to 6, y rises, so there is no negative association.
- The points do not follow a straight line, so the association is nonlinear.
- There is a clear upward trend as x increases, so there is an association, not no association.
- The points form one continuous upward group, not two separate clusters.

Snap & solve any problem in the app
Get step-by-step solutions on Sovi AI
Photo-based solutions with guided steps
Explore more problems and detailed explanations
- The scatter plot shows a nonlinear association.