QUESTION IMAGE
Question
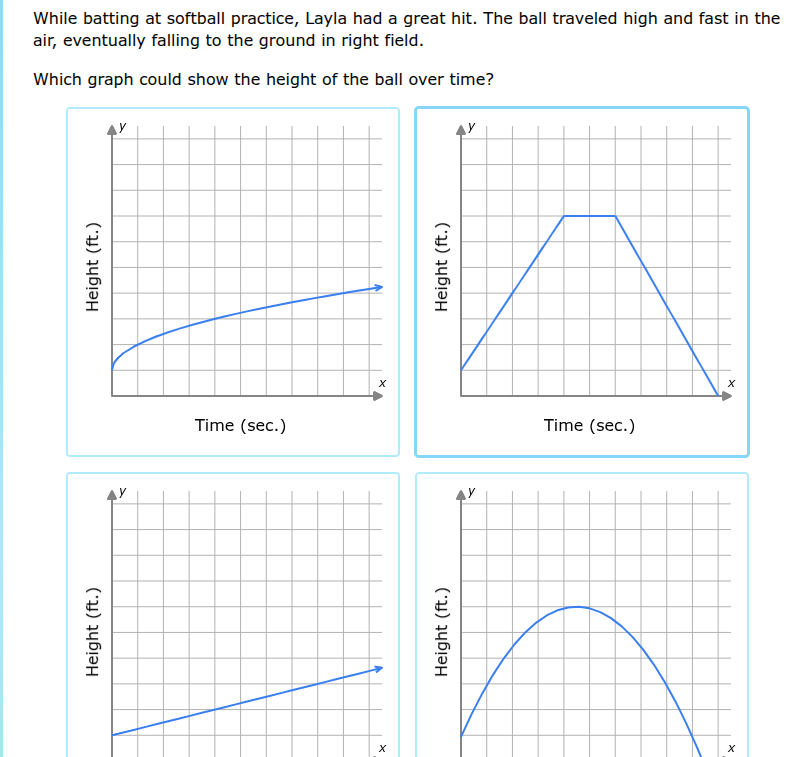
while batting at softball practice, layla had a great hit. the ball traveled high and fast in the air, eventually falling to the ground in right field. which graph could show the height of the ball over time?
Step1: Analyze the motion of the ball
When a ball is hit and travels through the air, its height over time follows a parabolic path (due to the effect of gravity, which causes a constant downward acceleration). This is a projectile motion scenario, and the height - time graph should be a parabola (a quadratic function), opening downwards.
Step2: Evaluate each graph
- The first graph: It is a curve that is increasing at a decreasing rate but does not form a parabola that peaks and then falls. It seems to be approaching a horizontal asymptote or just a curve with a decreasing slope of increase, not representing the ball's motion (the ball should rise to a peak and then fall).
- The second graph: It has a linear increase, a flat part, and then a linear decrease. The motion of a ball hit in the air is not linear in height - time (except for very simplified models, but in reality, due to gravity, the vertical motion is quadratic). So this graph does not represent the ball's motion.
- The third graph: It is a linear increase. The height of the ball should not increase linearly over time because gravity acts on it, causing the vertical velocity to change (decrease while going up and increase while coming down). So this graph is incorrect.
- The fourth graph: It is a parabola opening downwards, which matches the expected height - time relationship for a projectile (the ball rises to a maximum height and then falls back to the ground as time passes, following the equation \(h(t)=- 16t^{2}+v_{0}t + h_{0}\) where \(h(t)\) is height as a function of time \(t\), \(v_{0}\) is initial vertical velocity, and \(h_{0}\) is initial height).

Snap & solve any problem in the app
Get step-by-step solutions on Sovi AI
Photo-based solutions with guided steps
Explore more problems and detailed explanations
The graph in the bottom - right (the fourth graph, the one with the parabolic curve opening downwards) is the one that shows the height of the ball over time.