QUESTION IMAGE
Question
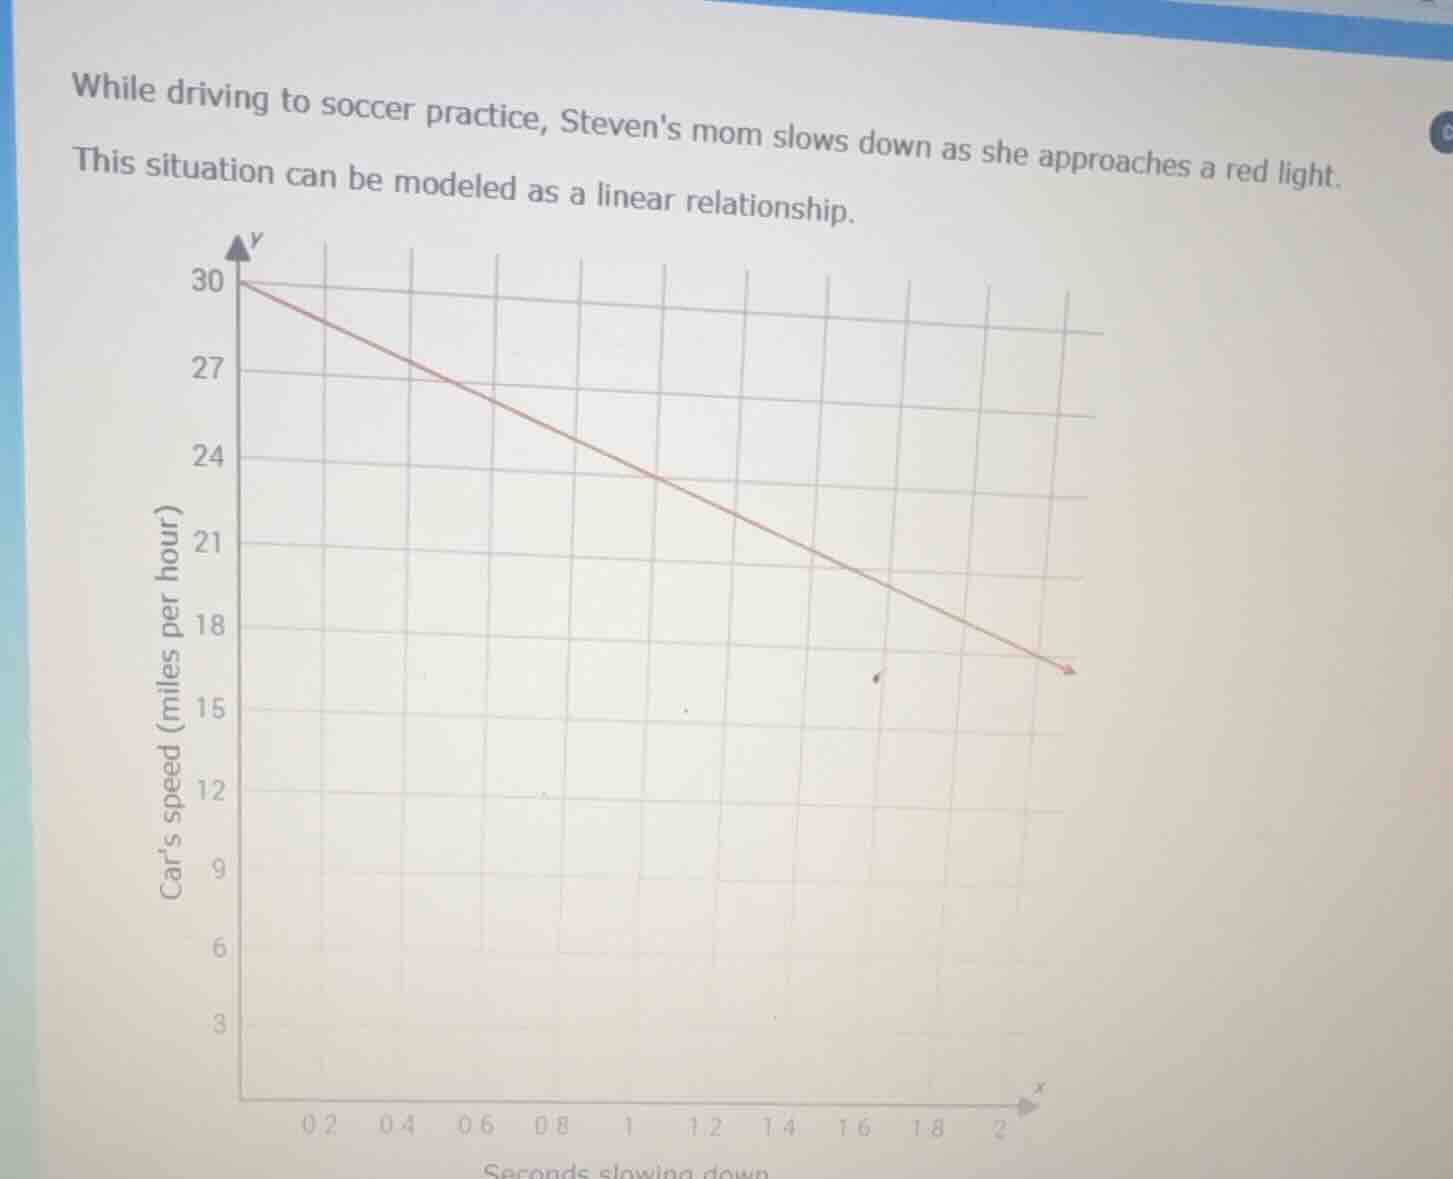
while driving to soccer practice, stevens mom slows down as she approaches a red light. this situation can be modeled as a linear relationship.
Assuming the problem is to find the equation of the line or the rate of deceleration, here's the solution:
Step 1: Identify two points
From the graph, when \( x = 0 \) (time = 0 seconds), \( y = 30 \) (speed = 30 mph). When \( x = 2 \) (time = 2 seconds), \( y = 16.5 \)? Wait, looking at the graph, at \( x = 2 \), the speed is 16.5? Wait, no, let's check the grid. Wait, the y-axis is car's speed (mph), x-axis is seconds slowing down. Let's take two clear points. At \( x = 0 \), \( y = 30 \). At \( x = 2 \), \( y = 16.5 \)? Wait, maybe better to take \( x = 0 \), \( y = 30 \) and \( x = 1 \), \( y = 24 \) (since at x=1, y=24). Let's confirm: from (0,30) to (1,24), the slope is \( \frac{24 - 30}{1 - 0} = -6 \). Wait, but let's check another point. At x=0.4, y=27? Wait, 30 - 0.46 = 30 - 2.4 = 27.6? No, maybe my initial point is wrong. Wait, the y-intercept is 30, so the equation is \( y = mx + 30 \). Let's take x=1, y=24. Then \( 24 = m(1) + 30 \), so \( m = 24 - 30 = -6 \). Wait, but at x=2, y=24 - 62 = 12? No, the graph at x=2 is around 16.5? Wait, maybe the grid is different. Wait, the x-axis is seconds, y-axis is mph. Let's re-express the time in hours? No, the time is in seconds, speed in mph. Wait, maybe the problem is to find the slope (rate of change of speed with respect to time).
Step 2: Calculate the slope (m)
The slope \( m \) of a line is given by \( m = \frac{y_2 - y_1}{x_2 - x_1} \). Let's take two points: (0, 30) and (2, 16.5)? Wait, no, looking at the graph, when x=2, the speed is 16.5? Wait, maybe the correct points are (0, 30) and (2, 16.5) is wrong. Wait, let's check the y-axis: 30, 27, 24, 21, 18, 15, 12, 9, 6, 3. The x-axis: 0, 0.2, 0.4, 0.6, 0.8, 1, 1.2, 1.4, 1.6, 1.8, 2. Let's take (0, 30) and (2, 16.5) – no, maybe (0, 30) and (1, 24). So \( x_1 = 0 \), \( y_1 = 30 \); \( x_2 = 1 \), \( y_2 = 24 \). Then \( m = \frac{24 - 30}{1 - 0} = -6 \) mph per second. Wait, but that would mean in 1 second, speed decreases by 6 mph. Let's check at x=0.4, y=30 - 6*0.4 = 30 - 2.4 = 27.6, but the graph shows y=27 at x=0.4? Close, maybe rounding. So the slope is -6 mph per second. So the equation of the line is \( y = -6x + 30 \), where \( y \) is speed (mph) and \( x \) is time (seconds).
Step 3: Interpret the slope
The slope \( m = -6 \) means the car is decelerating at a rate of 6 miles per hour per second.

Snap & solve any problem in the app
Get step-by-step solutions on Sovi AI
Photo-based solutions with guided steps
Explore more problems and detailed explanations
The equation of the line is \( y = -6x + 30 \), and the rate of deceleration is 6 miles per hour per second.