QUESTION IMAGE
Question
world gdp
2000
2021
■us
■china
■other
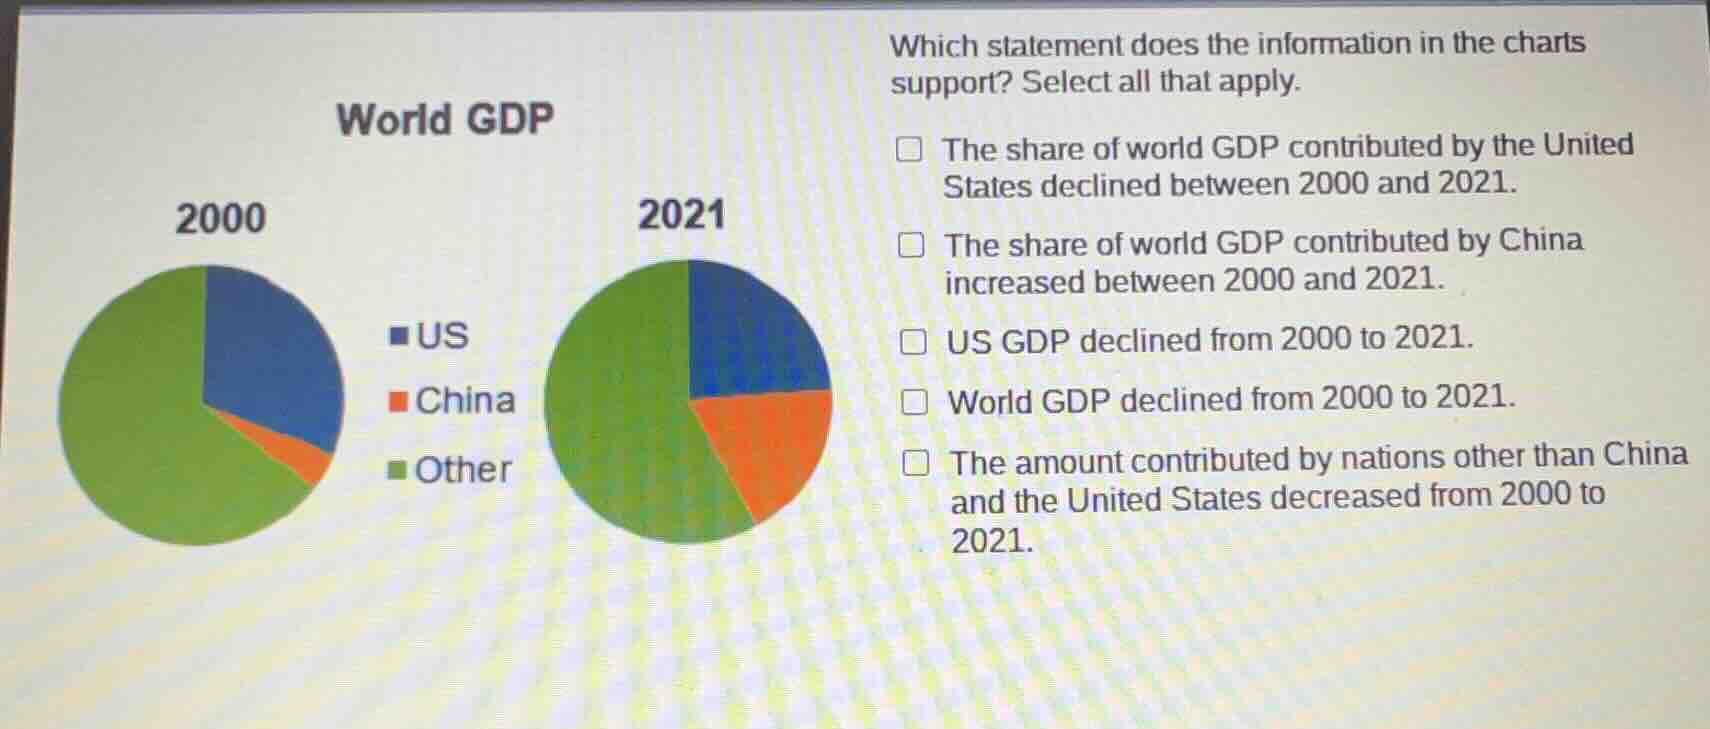
which statement does the information in the charts support? select all that apply.
□ the share of world gdp contributed by the united states declined between 2000 and 2021.
□ the share of world gdp contributed by china increased between 2000 and 2021.
□ us gdp declined from 2000 to 2021.
□ world gdp declined from 2000 to 2021.
□ the amount contributed by nations other than china and the united states decreased from 2000 to 2021.
Brief Explanations
- For the US share: The blue slice (US) is smaller in the 2021 pie chart than in 2000, so its share of world GDP declined.
- For China's share: The orange slice (China) is larger in the 2021 pie chart than in 2000, so its share of world GDP increased.
- For US GDP level: The pie charts only show shares of world GDP, not the actual dollar value of US GDP. A smaller share does not mean the total GDP declined, as world GDP could have grown overall.
- For world GDP level: Pie charts represent proportions of a whole; there is no data indicating the total size of world GDP declined.
- For other nations' amount: The green slice (Other) is larger in 2021, meaning their share increased. Even if their share stayed the same, world GDP growth would mean their total amount increased. There is no evidence their total amount decreased.

Snap & solve any problem in the app
Get step-by-step solutions on Sovi AI
Photo-based solutions with guided steps
Explore more problems and detailed explanations
- The share of world GDP contributed by the United States declined between 2000 and 2021.
- The share of world GDP contributed by China increased between 2000 and 2021.