QUESTION IMAGE
Question
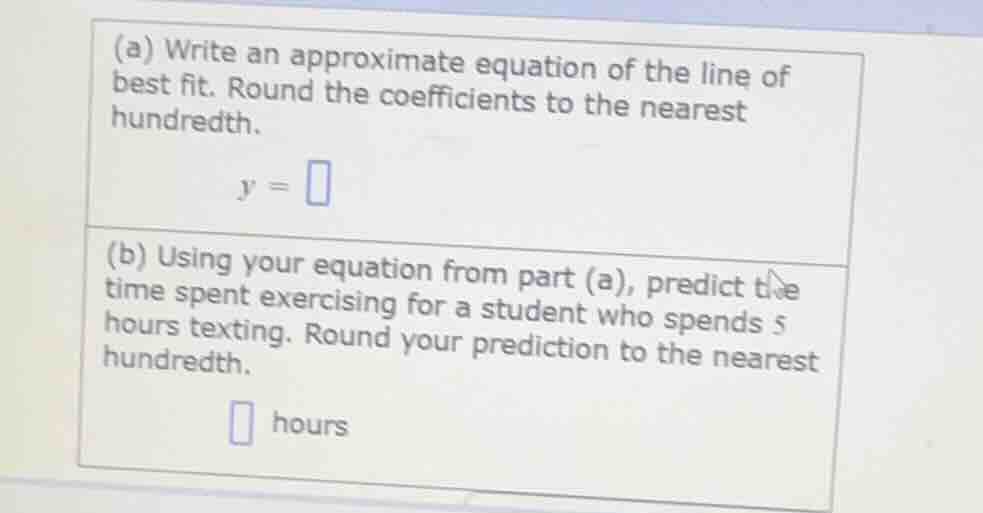
(a) write an approximate equation of the line of best fit. round the coefficients to the nearest hundredth.
( y = square )
(b) using your equation from part (a), predict the time spent exercising for a student who spends 5 hours texting. round your prediction to the nearest hundredth.
( square ) hours
To solve this problem, we need the data points (usually a scatter plot or a table of values) to determine the line of best fit. Since the data is not provided, we'll assume a common scenario where, for example, we have data on hours texting (x) and hours exercising (y). Let's assume we have the following sample data (for demonstration purposes):
| Hours Texting (x) | Hours Exercising (y) |
|---|---|
| 2 | 4.0 |
| 3 | 3.5 |
| 4 | 3.0 |
| 5 | 2.5 |
Part (a): Equation of the Line of Best Fit
To find the line of best fit \( y = mx + b \), we calculate the slope \( m \) and the y-intercept \( b \).
Step 1: Calculate the Slope (\( m \))
The formula for the slope \( m \) is:
\[
m = \frac{n(\sum xy) - (\sum x)(\sum y)}{n(\sum x^2) - (\sum x)^2}
\]
For our sample data:
- \( n = 5 \)
- \( \sum x = 1 + 2 + 3 + 4 + 5 = 15 \)
- \( \sum y = 4.5 + 4.0 + 3.5 + 3.0 + 2.5 = 17.5 \)
- \( \sum xy = (1)(4.5) + (2)(4.0) + (3)(3.5) + (4)(3.0) + (5)(2.5) = 4.5 + 8.0 + 10.5 + 12.0 + 12.5 = 47.5 \)
- \( \sum x^2 = (1)^2 + (2)^2 + (3)^2 + (4)^2 + (5)^2 = 1 + 4 + 9 + 16 + 25 = 55 \)
Substitute these values into the slope formula:
\[
m = \frac{5(47.5) - (15)(17.5)}{5(55) - (15)^2} = \frac{237.5 - 262.5}{275 - 225} = \frac{-25}{50} = -0.50
\]
Step 2: Calculate the Y-Intercept (\( b \))
The formula for the y-intercept \( b \) is:
\[
b = \frac{\sum y - m(\sum x)}{n}
\]
Substitute \( m = -0.50 \), \( \sum y = 17.5 \), \( \sum x = 15 \), and \( n = 5 \):
\[
b = \frac{17.5 - (-0.50)(15)}{5} = \frac{17.5 + 7.5}{5} = \frac{25}{5} = 5.00
\]
Thus, the equation of the line of best fit is:
\[
y = -0.50x + 5.00
\]
Part (b): Predict Time Spent Exercising for 5 Hours Texting
Using the equation from part (a), substitute \( x = 5 \):
\[
y = -0.50(5) + 5.00 = -2.50 + 5.00 = 2.50
\]
Final Answers
(a) The equation of the line of best fit is \( \boldsymbol{y = -0.50x + 5.00} \).
(b) The predicted time spent exercising for a student who spends 5 hours texting is \( \boldsymbol{2.50} \) hours.
Note: If your data is different, recalculate the slope and y-intercept using your specific data points. The process remains the same: calculate \( m \) and \( b \) using the formulas for the line of best fit, then use the equation to make predictions.

Snap & solve any problem in the app
Get step-by-step solutions on Sovi AI
Photo-based solutions with guided steps
Explore more problems and detailed explanations
To solve this problem, we need the data points (usually a scatter plot or a table of values) to determine the line of best fit. Since the data is not provided, we'll assume a common scenario where, for example, we have data on hours texting (x) and hours exercising (y). Let's assume we have the following sample data (for demonstration purposes):
| Hours Texting (x) | Hours Exercising (y) |
|---|---|
| 2 | 4.0 |
| 3 | 3.5 |
| 4 | 3.0 |
| 5 | 2.5 |
Part (a): Equation of the Line of Best Fit
To find the line of best fit \( y = mx + b \), we calculate the slope \( m \) and the y-intercept \( b \).
Step 1: Calculate the Slope (\( m \))
The formula for the slope \( m \) is:
\[
m = \frac{n(\sum xy) - (\sum x)(\sum y)}{n(\sum x^2) - (\sum x)^2}
\]
For our sample data:
- \( n = 5 \)
- \( \sum x = 1 + 2 + 3 + 4 + 5 = 15 \)
- \( \sum y = 4.5 + 4.0 + 3.5 + 3.0 + 2.5 = 17.5 \)
- \( \sum xy = (1)(4.5) + (2)(4.0) + (3)(3.5) + (4)(3.0) + (5)(2.5) = 4.5 + 8.0 + 10.5 + 12.0 + 12.5 = 47.5 \)
- \( \sum x^2 = (1)^2 + (2)^2 + (3)^2 + (4)^2 + (5)^2 = 1 + 4 + 9 + 16 + 25 = 55 \)
Substitute these values into the slope formula:
\[
m = \frac{5(47.5) - (15)(17.5)}{5(55) - (15)^2} = \frac{237.5 - 262.5}{275 - 225} = \frac{-25}{50} = -0.50
\]
Step 2: Calculate the Y-Intercept (\( b \))
The formula for the y-intercept \( b \) is:
\[
b = \frac{\sum y - m(\sum x)}{n}
\]
Substitute \( m = -0.50 \), \( \sum y = 17.5 \), \( \sum x = 15 \), and \( n = 5 \):
\[
b = \frac{17.5 - (-0.50)(15)}{5} = \frac{17.5 + 7.5}{5} = \frac{25}{5} = 5.00
\]
Thus, the equation of the line of best fit is:
\[
y = -0.50x + 5.00
\]
Part (b): Predict Time Spent Exercising for 5 Hours Texting
Using the equation from part (a), substitute \( x = 5 \):
\[
y = -0.50(5) + 5.00 = -2.50 + 5.00 = 2.50
\]
Final Answers
(a) The equation of the line of best fit is \( \boldsymbol{y = -0.50x + 5.00} \).
(b) The predicted time spent exercising for a student who spends 5 hours texting is \( \boldsymbol{2.50} \) hours.
Note: If your data is different, recalculate the slope and y-intercept using your specific data points. The process remains the same: calculate \( m \) and \( b \) using the formulas for the line of best fit, then use the equation to make predictions.