QUESTION IMAGE
Question
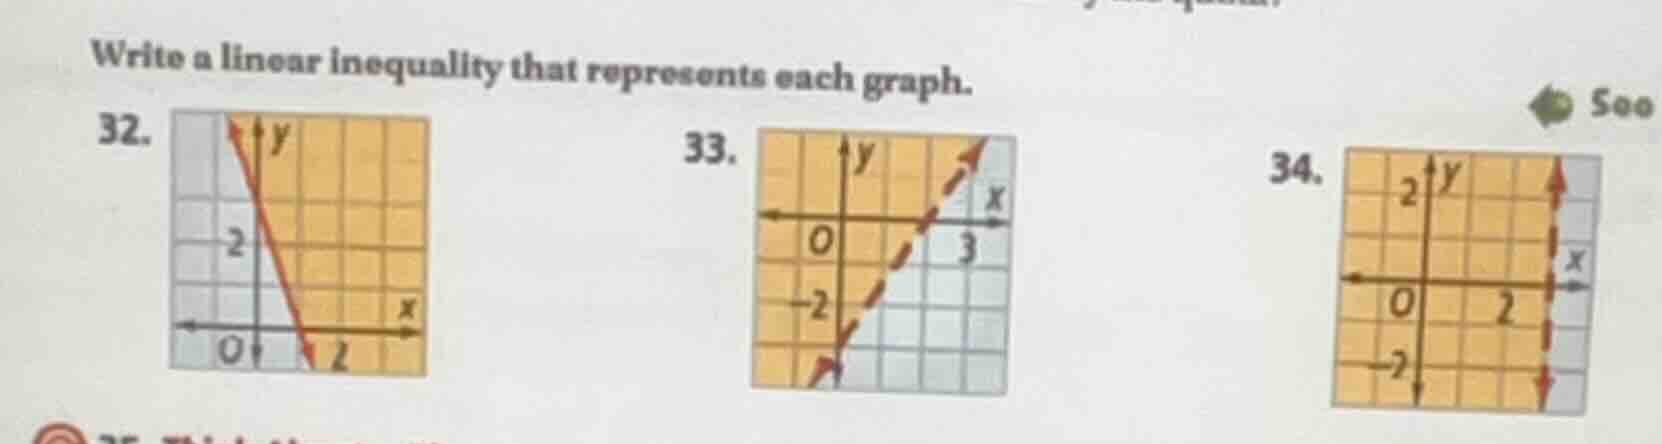
write a linear inequality that represents each graph.
32.
33.
34.
Step1: Find line eq for Q32
The line passes through $(0,3)$ and $(2,0)$. Slope $m=\frac{0-3}{2-0}=-\frac{3}{2}$. Equation: $y=-\frac{3}{2}x+3$, or $3x+2y=6$. Solid line, shaded above: $\boldsymbol{3x+2y\geq6}$
Step2: Find line eq for Q33
The line passes through $(0,-2)$ and $(3,1)$. Slope $m=\frac{1-(-2)}{3-0}=1$. Equation: $y=x-2$, or $x-y=2$. Dashed line, shaded below: $\boldsymbol{x-y>2}$
Step3: Find line eq for Q34
Vertical line at $x=3$. Dashed line, shaded right: $\boldsymbol{x>3}$

Snap & solve any problem in the app
Get step-by-step solutions on Sovi AI
Photo-based solutions with guided steps
Explore more problems and detailed explanations
- $3x+2y\geq6$
- $x-y>2$
- $x>3$