QUESTION IMAGE
Question
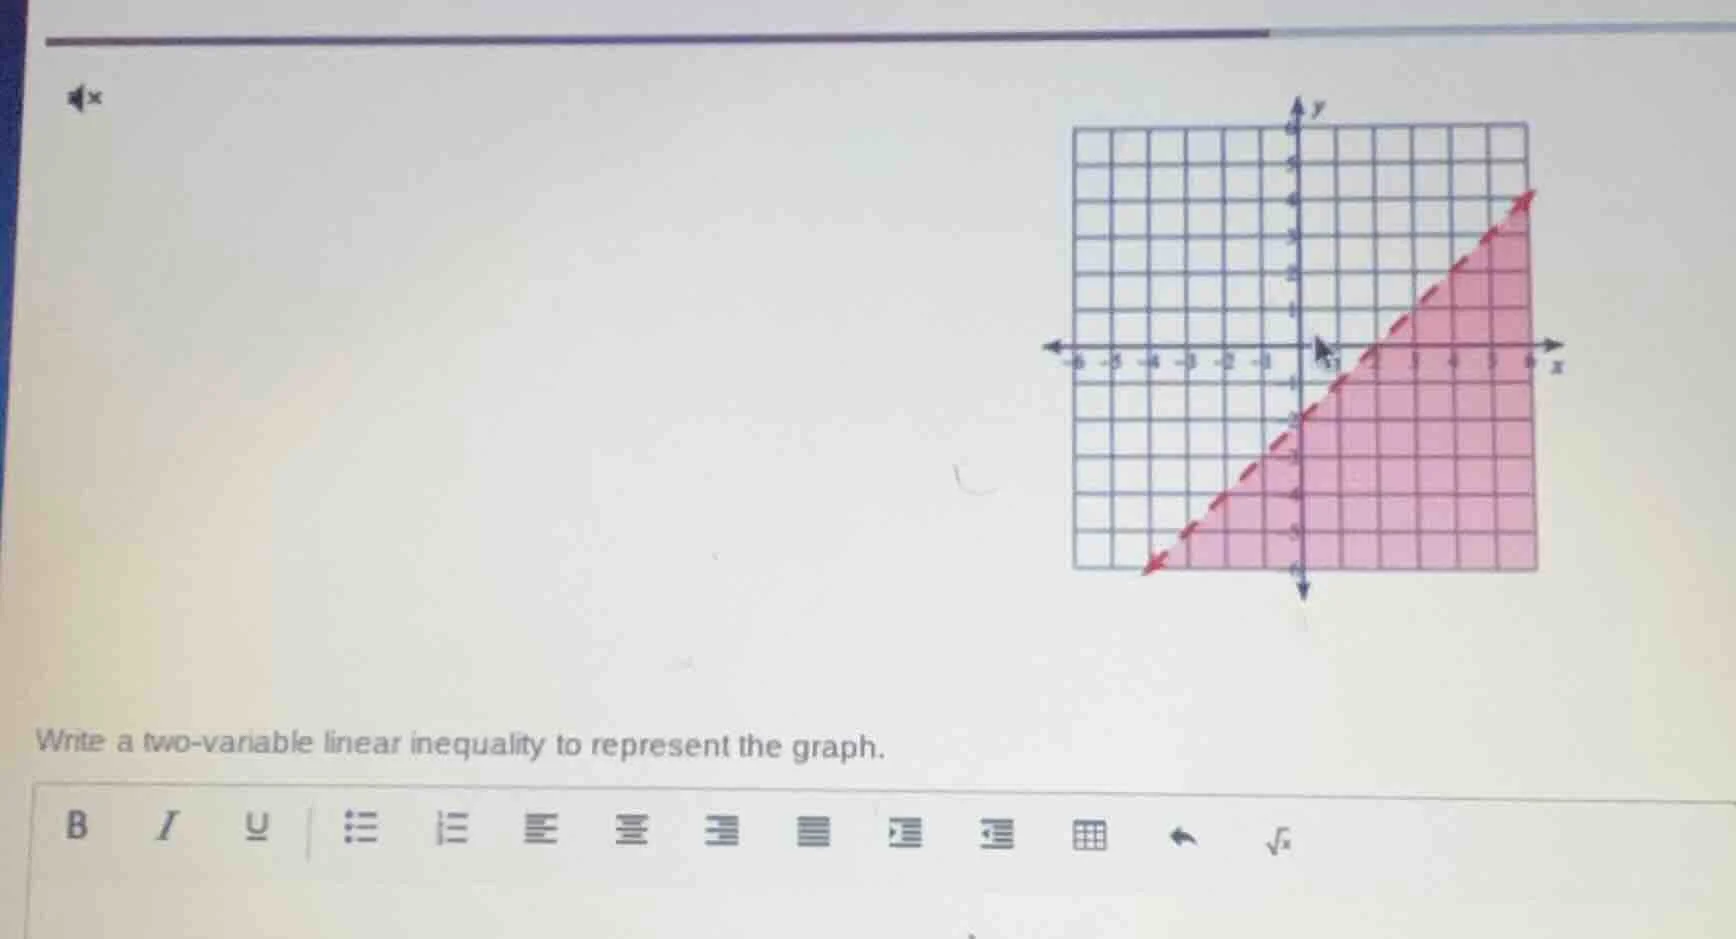
write a two - variable linear inequality to represent the graph.
Step1: Find the slope of the line
First, identify two points on the line. From the graph, we can see that the line passes through \((2, 0)\) and \((0, -2)\). The slope \(m\) is calculated using the formula \(m=\frac{y_2 - y_1}{x_2 - x_1}\).
Substituting the points \((x_1,y_1)=(2,0)\) and \((x_2,y_2)=(0, - 2)\) into the formula:
\(m=\frac{-2 - 0}{0 - 2}=\frac{-2}{-2}=1\)
Step2: Find the equation of the line
Using the slope - intercept form \(y=mx + b\), where \(m\) is the slope and \(b\) is the y - intercept. We know that the line crosses the y - axis at \((0,-2)\), so \(b=-2\) and \(m = 1\). So the equation of the line is \(y=x - 2\).
Step3: Determine the inequality symbol
The line is dashed, which means the inequality is either \(y>x - 2\) or \(y
\(0\) compared to \(0 - 2=-2\). Since \(0>-2\), the inequality is \(y>x - 2\) (or we can rewrite it as \(x - y<2\) or other equivalent forms, but \(y>x - 2\) is a two - variable linear inequality representing the graph).

Snap & solve any problem in the app
Get step-by-step solutions on Sovi AI
Photo-based solutions with guided steps
Explore more problems and detailed explanations
\(y>x - 2\)