QUESTION IMAGE
Question
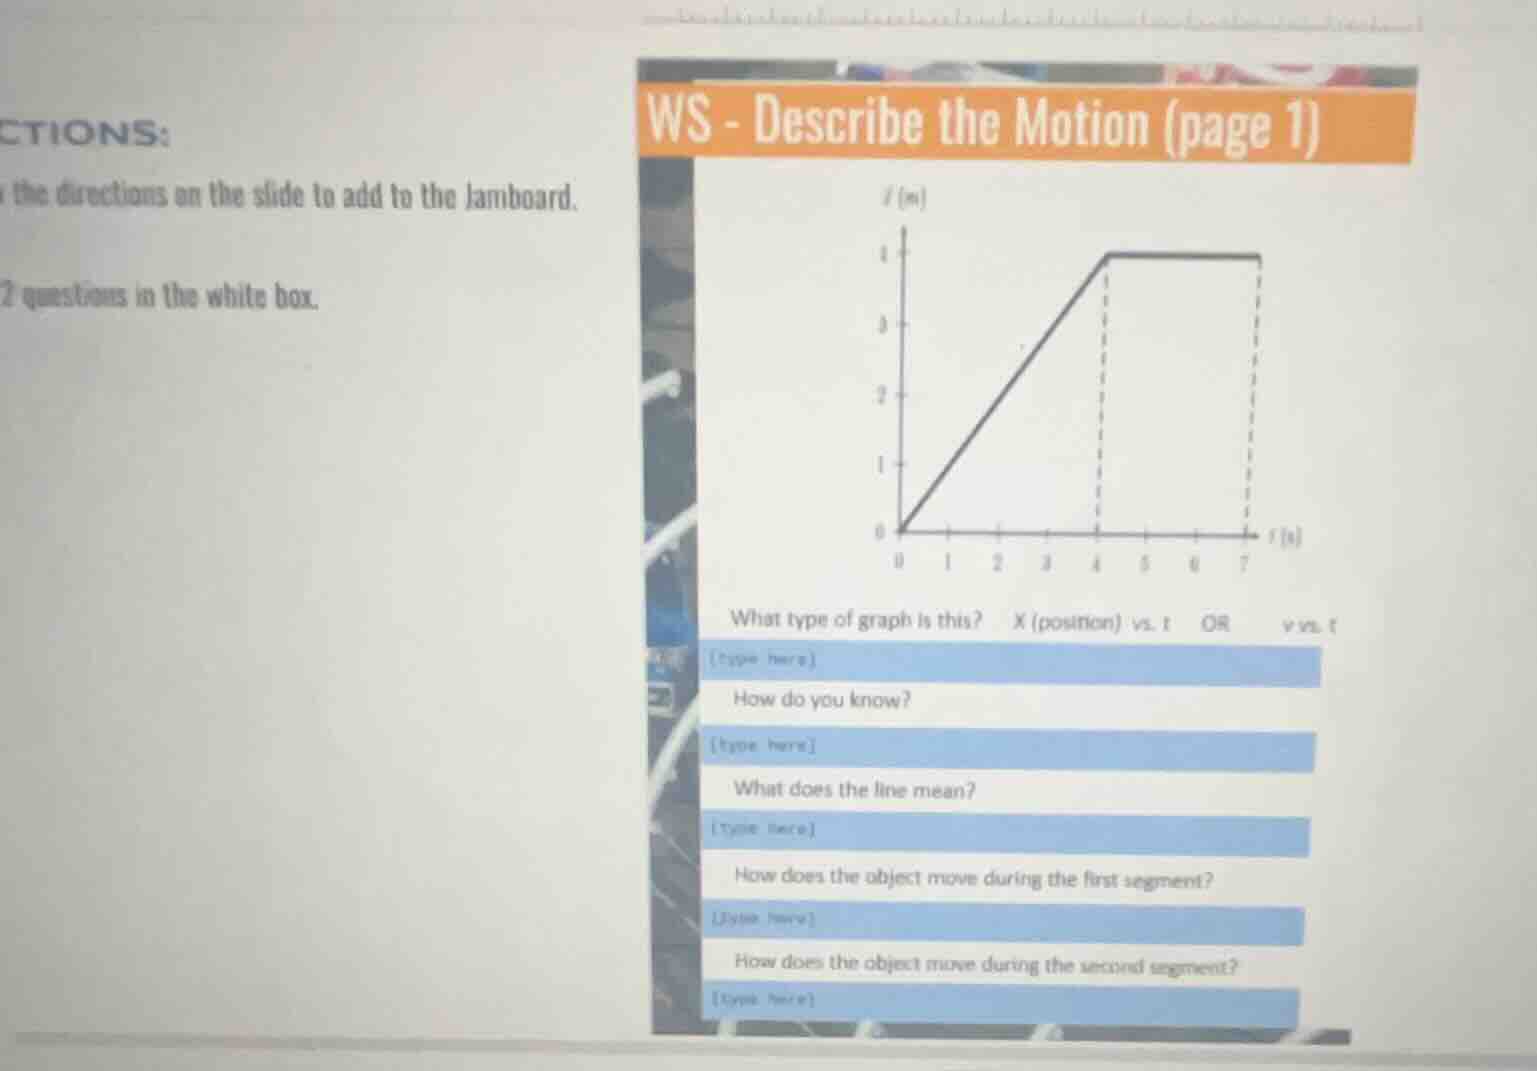
ws - describe the motion (page 1)
what type of graph is this? x (position) vs. t or v vs. t
(type here)
how do you know?
(type here)
what does the line mean?
(type here)
how does the object move during the first segment?
(type here)
how does the object move during the second segment?
(type here)
Brief Explanations
- The y-axis is labeled $x$ (position in meters) and the x-axis is labeled $t$ (time in seconds), so this is a position vs. time graph.
- The graph's y-axis is marked with position units (meters, $m$) and the x-axis with time units (seconds, $s$), which defines it as position vs. time.
- Each line segment represents the object's position change over time, showing its motion state.
- The first segment is a straight, upward-sloping line from (0,0) to (4,4), meaning position increases at a constant rate over time.
- The second segment is a horizontal line from (4,4) to (7,4), meaning position does not change as time passes.

Snap & solve any problem in the app
Get step-by-step solutions on Sovi AI
Photo-based solutions with guided steps
Explore more problems and detailed explanations
- What type of graph is this? $\boldsymbol{X \text{ (position) vs. } t}$
- How do you know? The y-axis is position ($x$, in m) and x-axis is time ($t$, in s).
- What does the line mean? It shows object's position over time.
- How does the object move during the first segment? Moves at constant positive speed.
- How does the object move during the second segment? Remains stationary (no motion).