QUESTION IMAGE
Question
you must show all work to receive full credit.
question #1 - 15 points
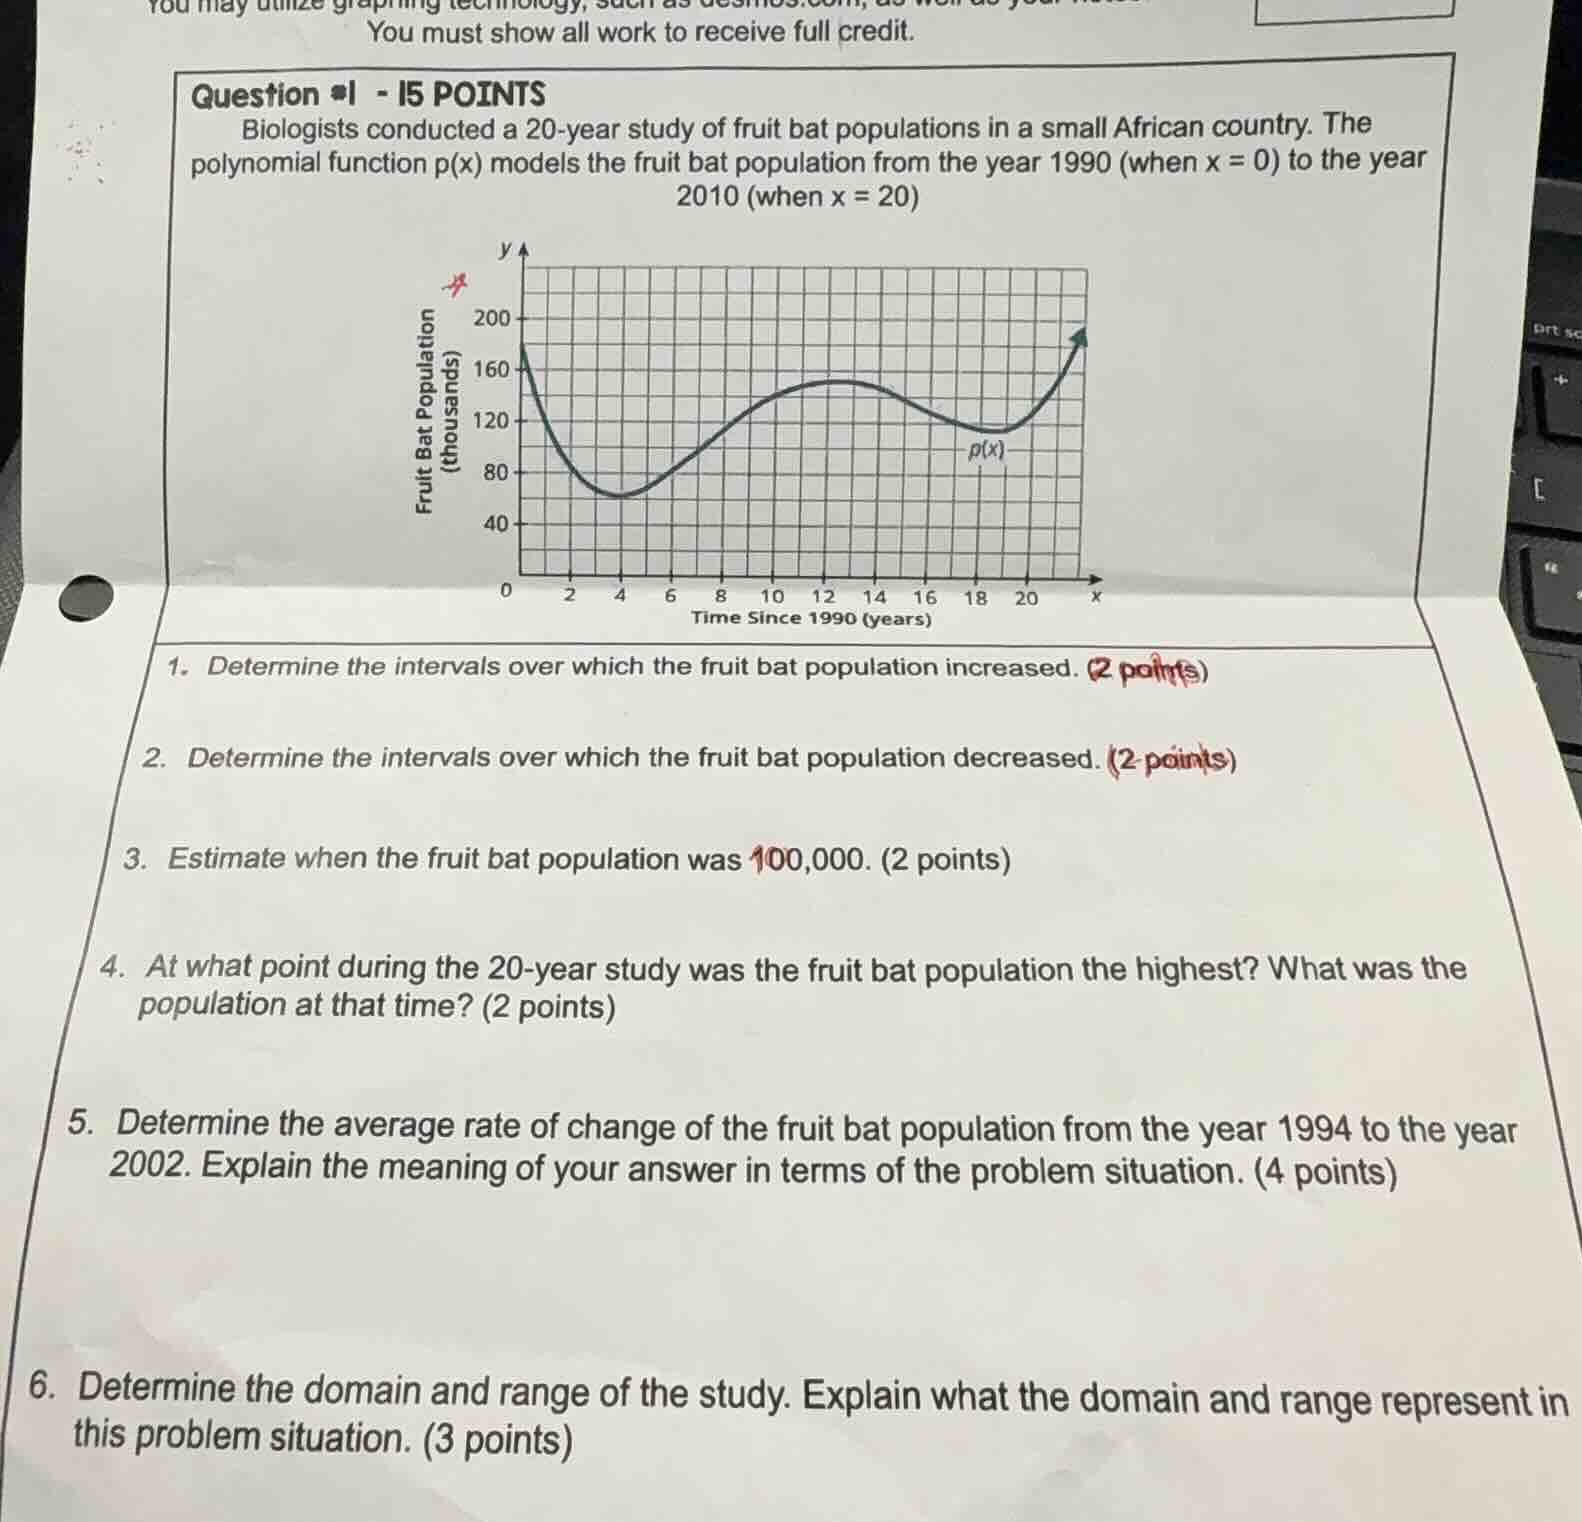
biologists conducted a 20-year study of fruit bat populations in a small african country. the polynomial function p(x) models the fruit bat population from the year 1990 (when x = 0) to the year 2010 (when x = 20)
chart: x-axis time since 1990 (years) from 0 to 20, y-axis fruit bat population (thousands) from 0 to 200, curve p(x)
- determine the intervals over which the fruit bat population increased. (2 points)
- determine the intervals over which the fruit bat population decreased. (2 points)
- estimate when the fruit bat population was 100,000. (2 points)
- at what point during the 20-year study was the fruit bat population the highest? what was the population at that time? (2 points)
- determine the average rate of change of the fruit bat population from the year 1994 to the year 2002. explain the meaning of your answer in terms of the problem situation. (4 points)
- determine the domain and range of the study. explain what the domain and range represent in this problem situation. (3 points)
Step1: Identify increasing intervals
Look for where $p(x)$ rises on the graph.
The graph goes up from $x=3$ to $x=14$, and $x=19$ to $x=20$.
Step2: Identify decreasing intervals
Look for where $p(x)$ falls on the graph.
The graph goes down from $x=0$ to $x=3$, and $x=14$ to $x=19$.
Step3: Find x for 100,000 population
100,000 = 100 (thousands). Match $y=100$ to x-values.
The graph hits $y=100$ at $x=2$ and $x=7$.
Step4: Locate maximum population
Find the highest point on the graph.
The highest point is at $x=0$ (1990) with $y=170$ (thousands).
Step5: Calculate average rate of change
1994 is $x=4$, 2002 is $x=12$. Use $\frac{p(12)-p(4)}{12-4}$.
$p(4)=70$, $p(12)=150$. $\frac{150-70}{12-4}=\frac{80}{8}=10$.
Step6: Define domain and range
Domain is all valid x-values (time), range is all valid y-values (population).
Domain: $0 \leq x \leq 20$; Range: $70 \leq y \leq 190$.

Snap & solve any problem in the app
Get step-by-step solutions on Sovi AI
Photo-based solutions with guided steps
Explore more problems and detailed explanations
- The population increased on the intervals $(3,14)$ and $(19,20)$ (years 1993-2004 and 2009-2010).
- The population decreased on the intervals $(0,3)$ and $(14,19)$ (years 1990-1993 and 2004-2009).
- The population was 100,000 at $x=2$ (1992) and $x=7$ (1997).
- The highest population was in 1990 ($x=0$), with a population of 170,000.
- The average rate of change is 10. This means the fruit bat population increased by an average of 10,000 bats per year between 1994 and 2002.
- Domain: $[0,20]$; this represents the 20-year study period from 1990 to 2010. Range: $[70,190]$; this represents the fruit bat population (in thousands) ranging from a minimum of 70,000 to a maximum of 190,000 during the study.