QUESTION IMAGE
Question
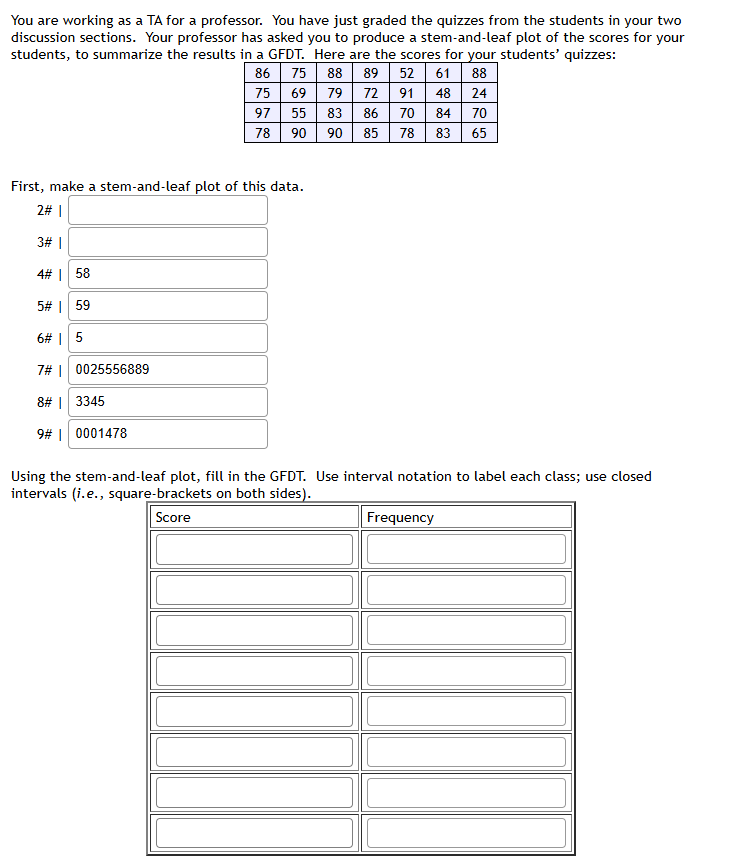
you are working as a ta for a professor. you have just graded the quizzes from the students in your two discussion sections. your professor has asked you to produce a stem - and - leaf plot of the scores for your students, to summarize the results in a gfdt. here are the scores for your students’ quizzes: 86, 75, 88, 89, 52, 61, 88, 75, 69, 79, 72, 91, 48, 24, 97, 55, 83, 86, 70, 84, 78, 90, 90, 85, 78, 83, 65. first, make a stem - and - leaf plot of this data. 2# | 3# | 4# | 58 5# | 59 6# | 5 7# | 002556889 8# | 3345 9# | 0001478. using the stem - and - leaf plot, fill in the gfdt. use interval notation to label each class; use closed intervals (i.e., square - brackets on both sides).
Step 1: Organize the Data
First, list out all the scores: 86, 75, 88, 89, 52, 61, 88, 75, 69, 79, 72, 91, 48, 24, 97, 55, 83, 86, 70, 84, 70, 78, 90, 90, 85, 78, 83, 65.
Step 2: Create the Stem - and - Leaf Plot
- Stem 2: Leaf is 4 (from score 24)
- Stem 3: No scores, so no leaves.
- Stem 4: Leaf is 8 (from score 48)
- Stem 5: Leaves are 2, 5 (from scores 52, 55)
- Stem 6: Leaves are 1, 5, 9 (from scores 61, 65, 69)
- Stem 7: Leaves are 0, 0, 2, 5, 5, 8, 8, 9 (from scores 70, 70, 72, 75, 75, 78, 78, 79)
- Stem 8: Leaves are 3, 3, 4, 5, 6, 6, 8, 8, 9 (from scores 83, 83, 84, 85, 86, 86, 88, 88, 89)
- Stem 9: Leaves are 0, 0, 1, 7 (from scores 90, 90, 91, 97)
Step 3: Determine the Classes for GFDT
We can see that the scores range from 24 to 97. We can create classes with a width that makes sense. Let's use class width of 10.
- Class 1: \([20, 30]\)
- Class 2: \([30, 40]\)
- Class 3: \([40, 50]\)
- Class 4: \([50, 60]\)
- Class 5: \([60, 70]\)
- Class 6: \([70, 80]\)
- Class 7: \([80, 90]\)
- Class 8: \([90, 100]\)
Step 4: Calculate Frequencies for Each Class
- Class \([20, 30]\): Scores in this class: 24. Frequency = 1.
- Class \([30, 40]\): No scores. Frequency = 0.
- Class \([40, 50]\): Score: 48. Frequency = 1.
- Class \([50, 60]\): Scores: 52, 55. Frequency = 2.
- Class \([60, 70]\): Scores: 61, 65, 69. Frequency = 3.
- Class \([70, 80]\): Scores: 70, 70, 72, 75, 75, 78, 78, 79. Frequency = 8.
- Class \([80, 90]\): Scores: 83, 83, 84, 85, 86, 86, 88, 88, 89. Frequency = 9.
- Class \([90, 100]\): Scores: 90, 90, 91, 97. Frequency = 4.
Step 5: Fill in the GFDT
| Score | Frequency |
|---|---|
| \([30, 40]\) | 0 |
| \([40, 50]\) | 1 |
| \([50, 60]\) | 2 |
| \([60, 70]\) | 3 |
| \([70, 80]\) | 8 |
| \([80, 90]\) | 9 |
| \([90, 100]\) | 4 |
Final Answer (GFDT Table)
| Score | Frequency |
|---|---|
| \([30, 40]\) | 0 |
| \([40, 50]\) | 1 |
| \([50, 60]\) | 2 |
| \([60, 70]\) | 3 |
| \([70, 80]\) | 8 |
| \([80, 90]\) | 9 |
| \([90, 100]\) | 4 |

Snap & solve any problem in the app
Get step-by-step solutions on Sovi AI
Photo-based solutions with guided steps
Explore more problems and detailed explanations
Step 1: Organize the Data
First, list out all the scores: 86, 75, 88, 89, 52, 61, 88, 75, 69, 79, 72, 91, 48, 24, 97, 55, 83, 86, 70, 84, 70, 78, 90, 90, 85, 78, 83, 65.
Step 2: Create the Stem - and - Leaf Plot
- Stem 2: Leaf is 4 (from score 24)
- Stem 3: No scores, so no leaves.
- Stem 4: Leaf is 8 (from score 48)
- Stem 5: Leaves are 2, 5 (from scores 52, 55)
- Stem 6: Leaves are 1, 5, 9 (from scores 61, 65, 69)
- Stem 7: Leaves are 0, 0, 2, 5, 5, 8, 8, 9 (from scores 70, 70, 72, 75, 75, 78, 78, 79)
- Stem 8: Leaves are 3, 3, 4, 5, 6, 6, 8, 8, 9 (from scores 83, 83, 84, 85, 86, 86, 88, 88, 89)
- Stem 9: Leaves are 0, 0, 1, 7 (from scores 90, 90, 91, 97)
Step 3: Determine the Classes for GFDT
We can see that the scores range from 24 to 97. We can create classes with a width that makes sense. Let's use class width of 10.
- Class 1: \([20, 30]\)
- Class 2: \([30, 40]\)
- Class 3: \([40, 50]\)
- Class 4: \([50, 60]\)
- Class 5: \([60, 70]\)
- Class 6: \([70, 80]\)
- Class 7: \([80, 90]\)
- Class 8: \([90, 100]\)
Step 4: Calculate Frequencies for Each Class
- Class \([20, 30]\): Scores in this class: 24. Frequency = 1.
- Class \([30, 40]\): No scores. Frequency = 0.
- Class \([40, 50]\): Score: 48. Frequency = 1.
- Class \([50, 60]\): Scores: 52, 55. Frequency = 2.
- Class \([60, 70]\): Scores: 61, 65, 69. Frequency = 3.
- Class \([70, 80]\): Scores: 70, 70, 72, 75, 75, 78, 78, 79. Frequency = 8.
- Class \([80, 90]\): Scores: 83, 83, 84, 85, 86, 86, 88, 88, 89. Frequency = 9.
- Class \([90, 100]\): Scores: 90, 90, 91, 97. Frequency = 4.
Step 5: Fill in the GFDT
| Score | Frequency |
|---|---|
| \([30, 40]\) | 0 |
| \([40, 50]\) | 1 |
| \([50, 60]\) | 2 |
| \([60, 70]\) | 3 |
| \([70, 80]\) | 8 |
| \([80, 90]\) | 9 |
| \([90, 100]\) | 4 |
Final Answer (GFDT Table)
| Score | Frequency |
|---|---|
| \([30, 40]\) | 0 |
| \([40, 50]\) | 1 |
| \([50, 60]\) | 2 |
| \([60, 70]\) | 3 |
| \([70, 80]\) | 8 |
| \([80, 90]\) | 9 |
| \([90, 100]\) | 4 |